Manual fan speed settings, individual measurements detailed
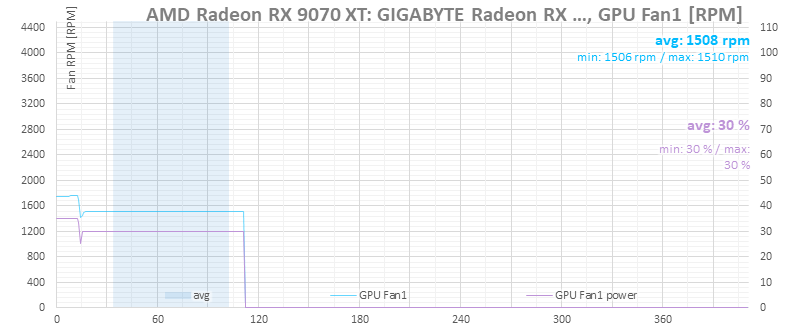
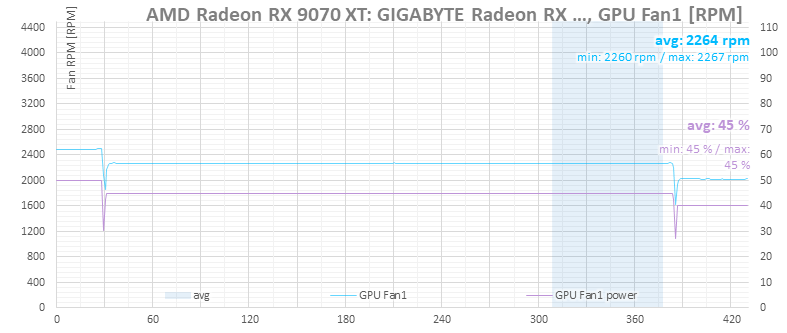
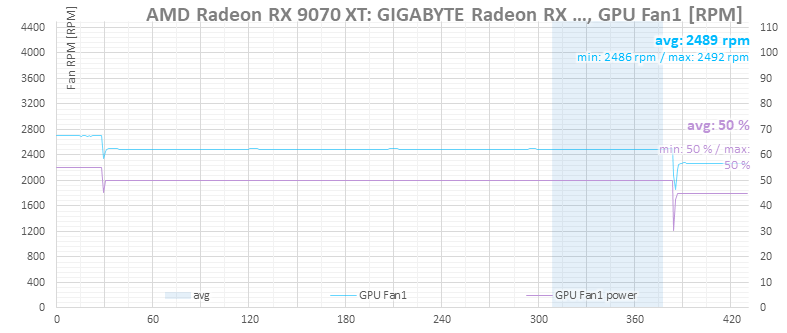
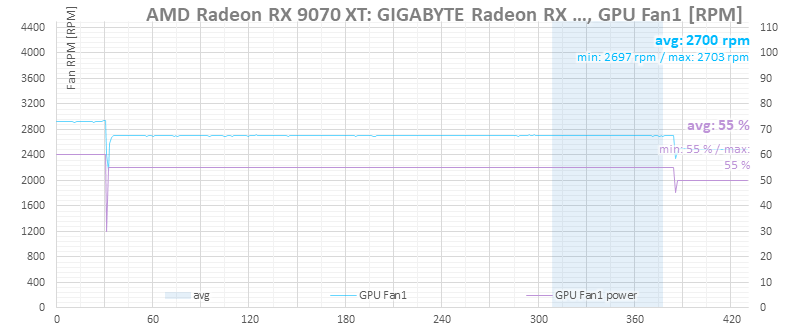
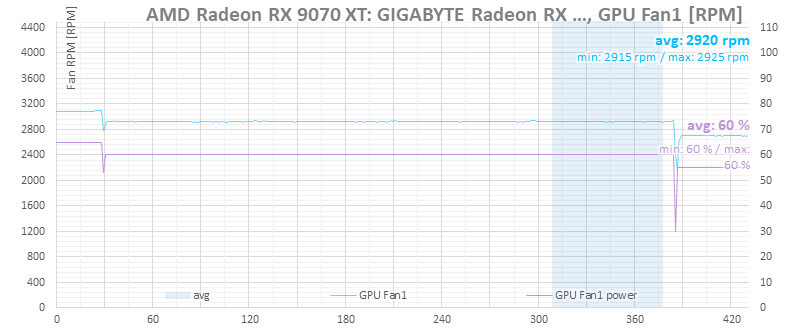
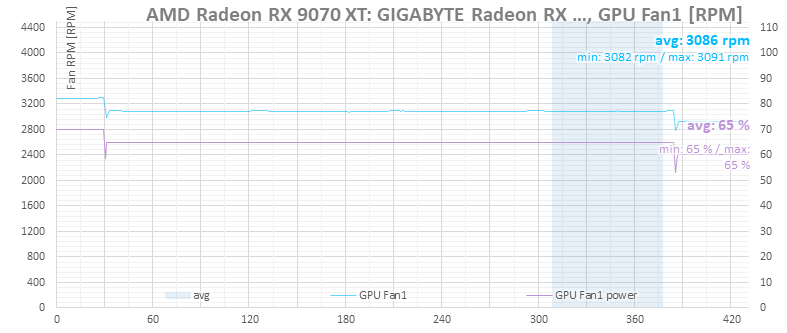
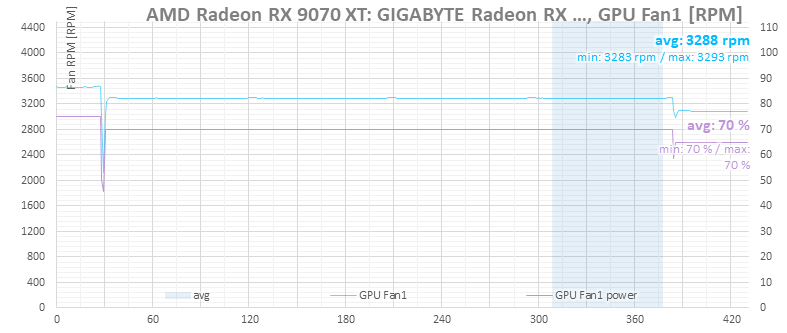
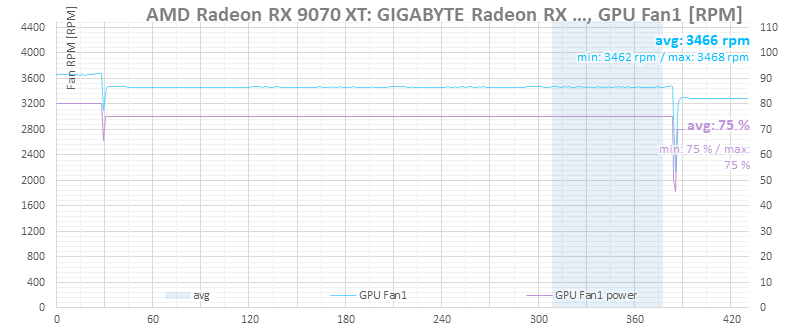
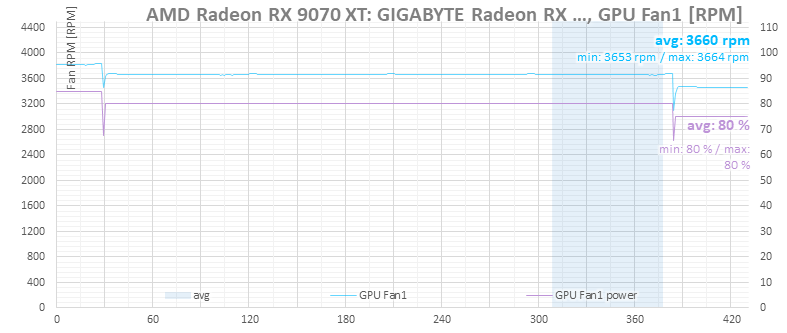
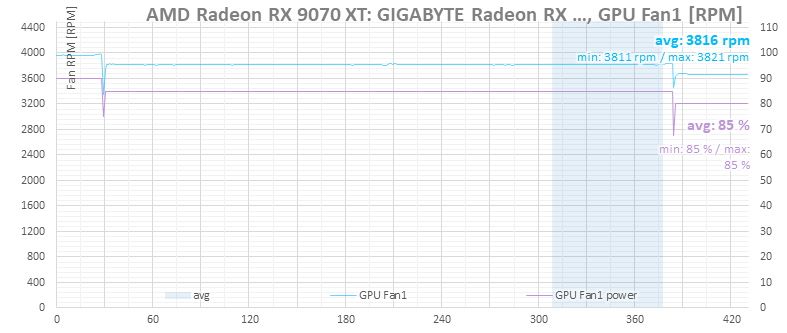
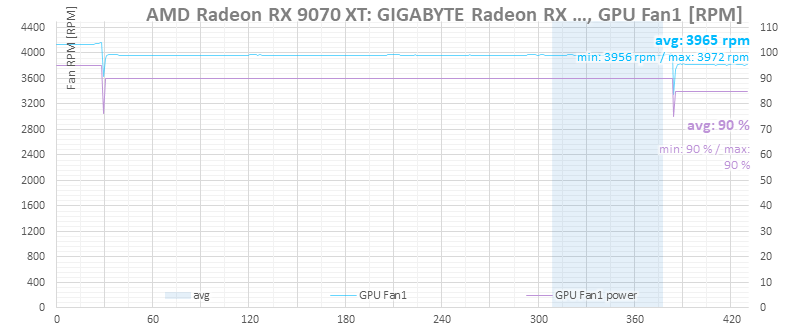
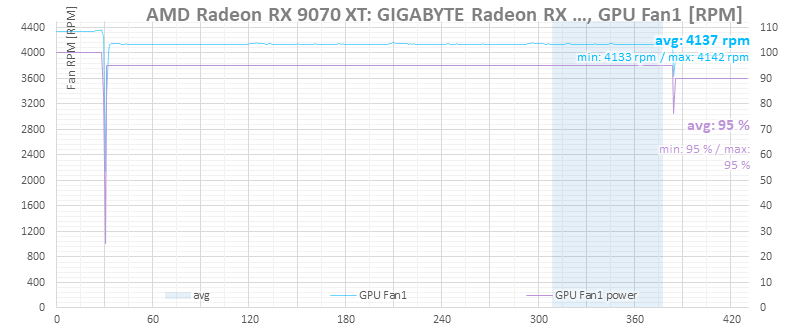
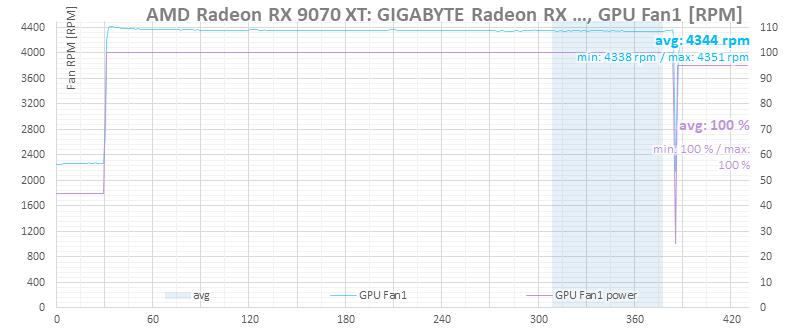
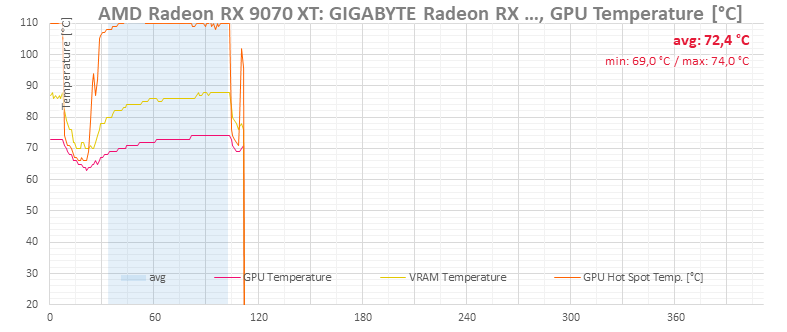
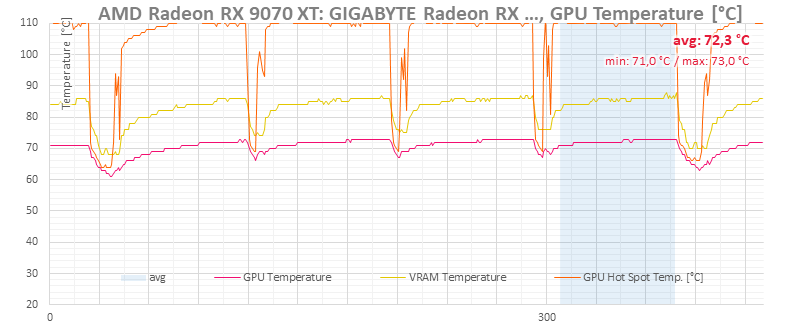
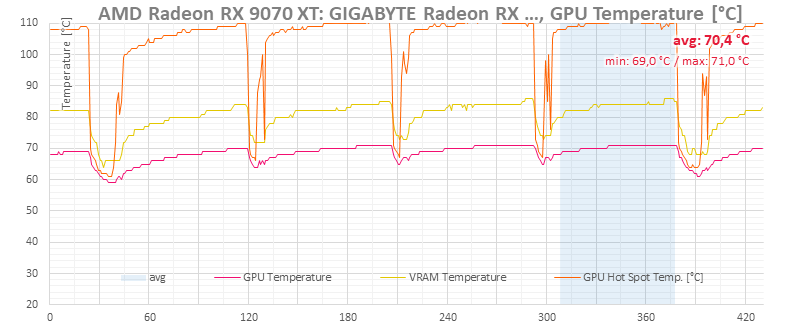
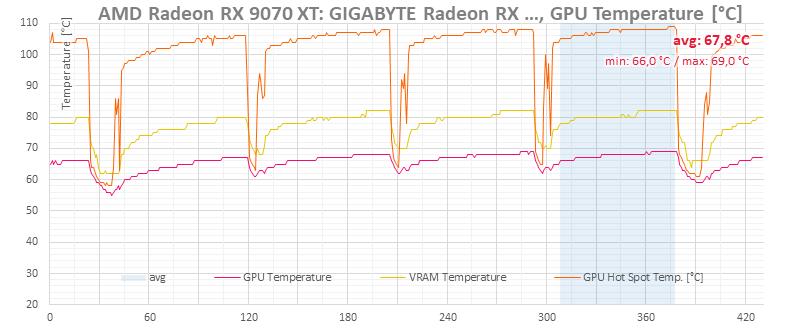
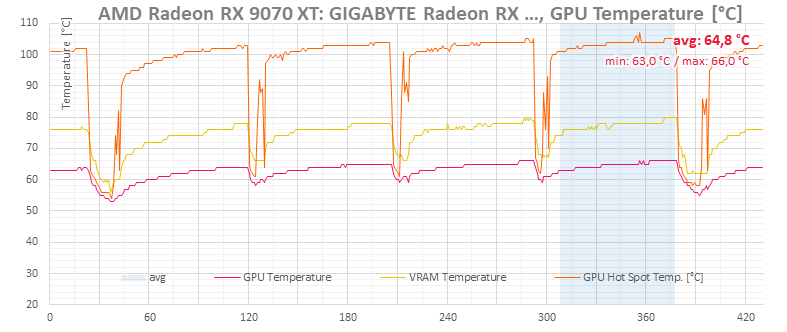
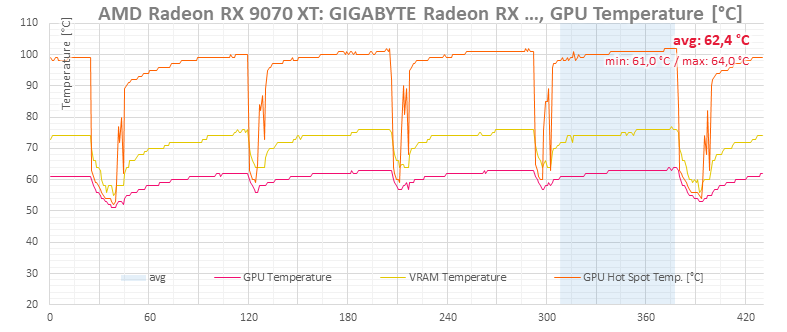
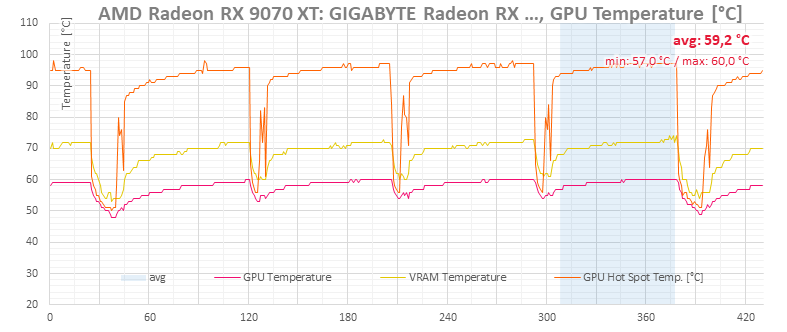
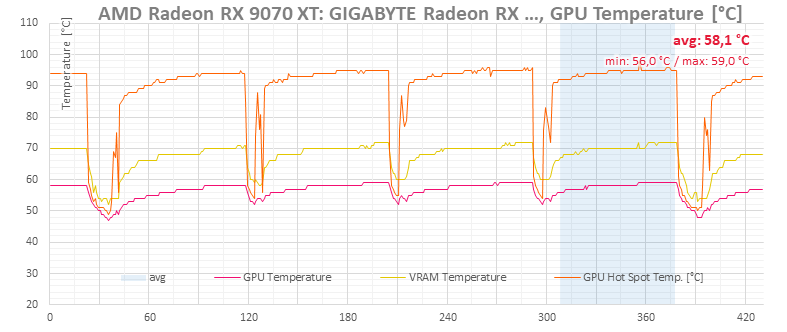
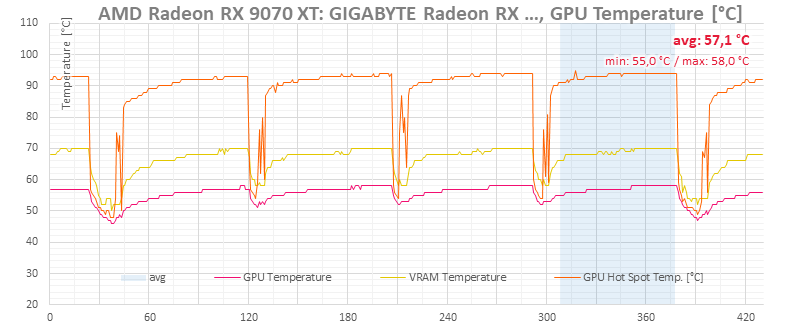
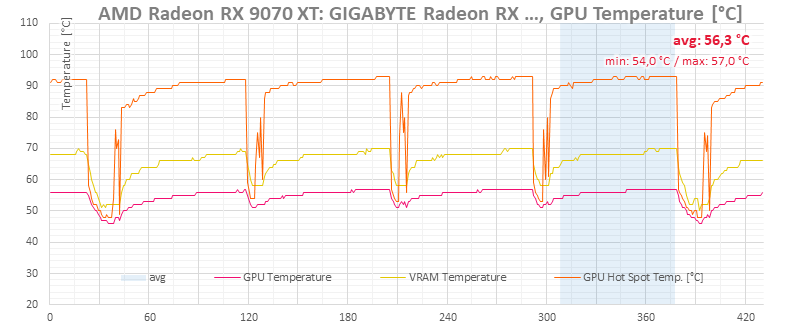
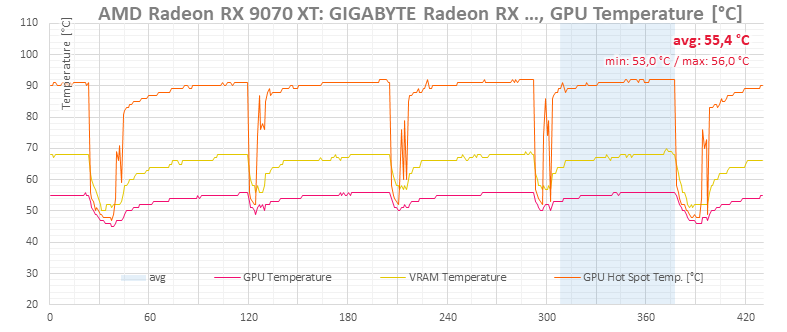
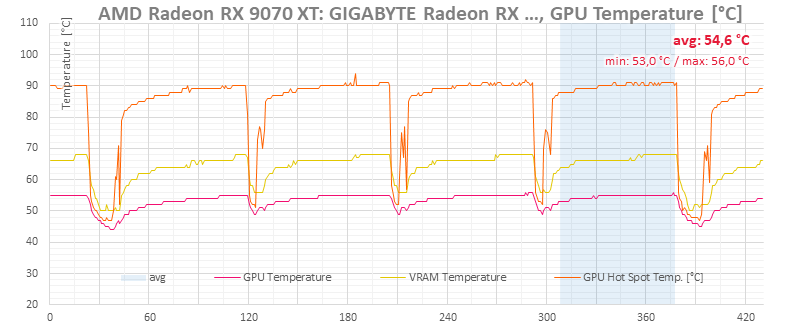
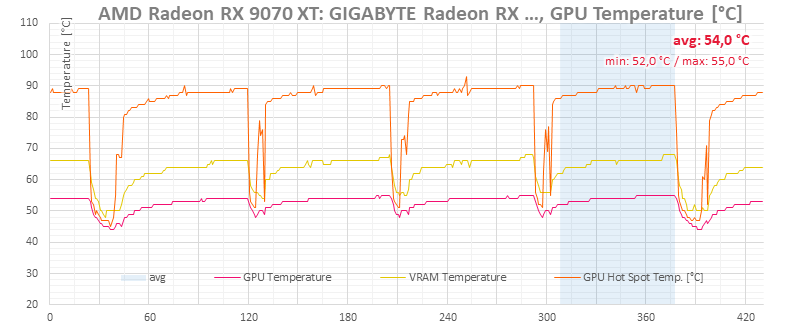
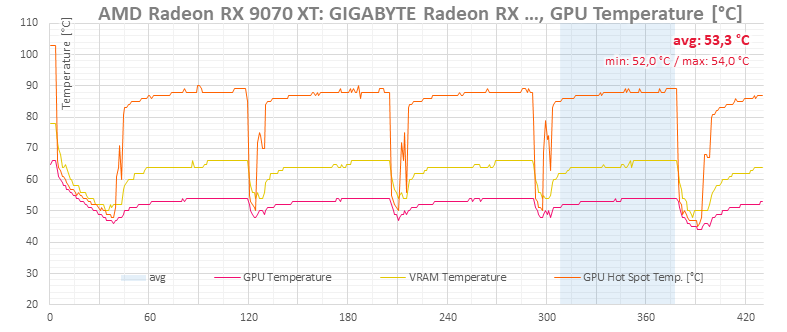
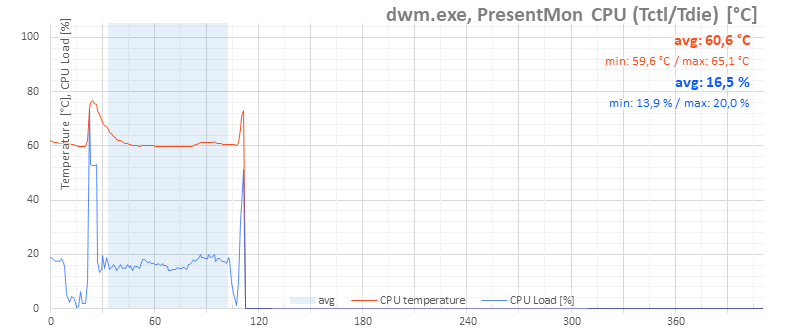
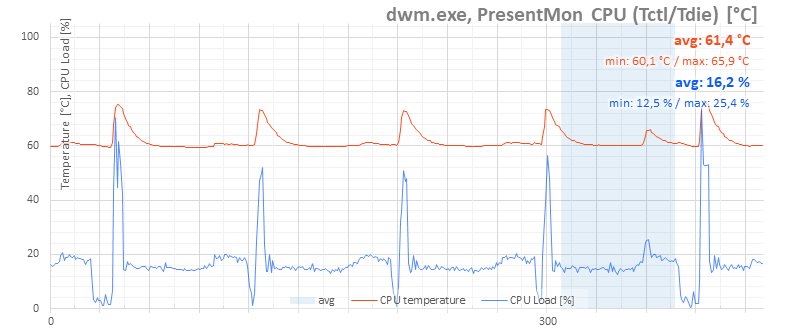
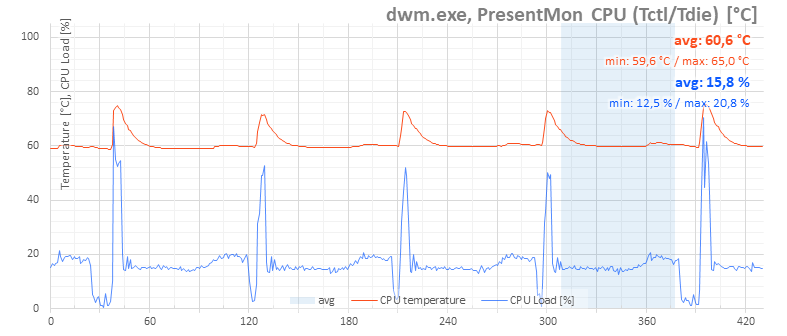
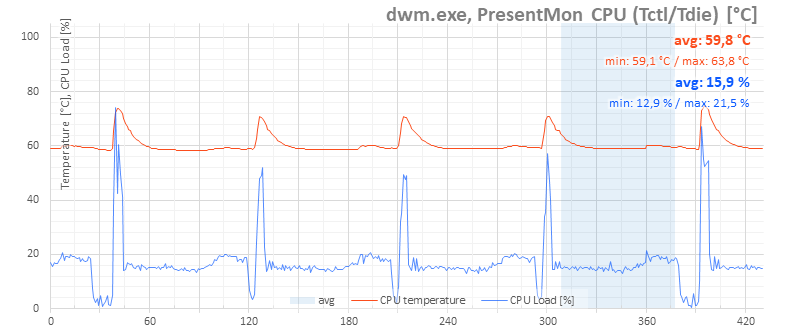
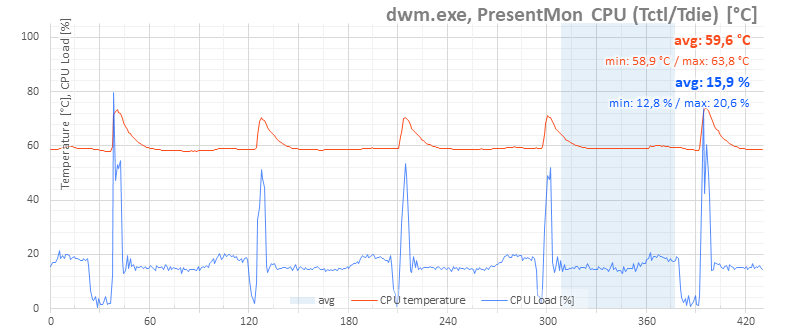
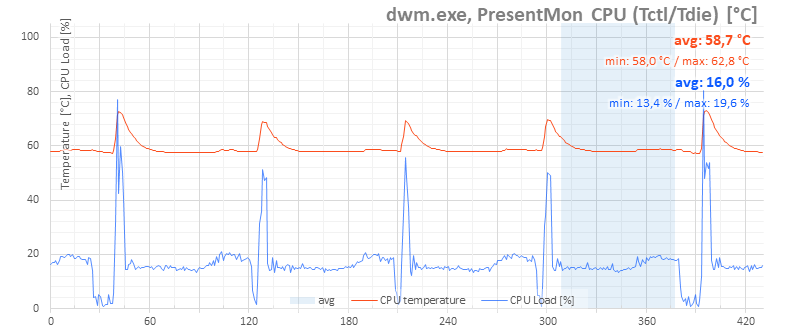
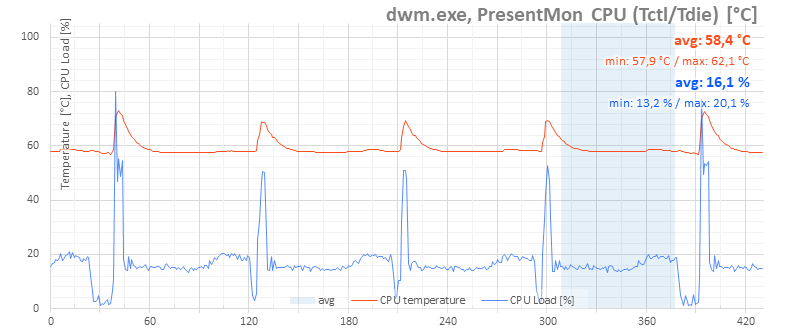
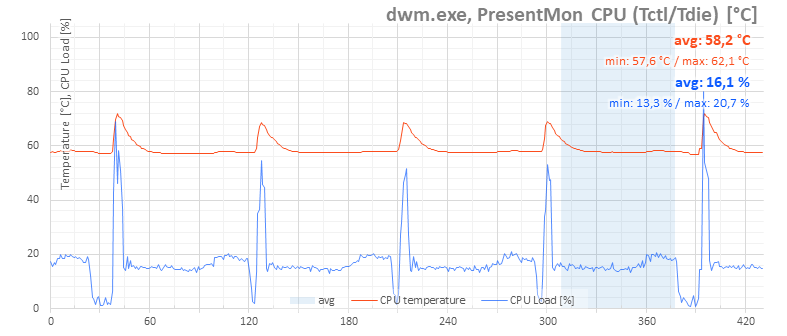
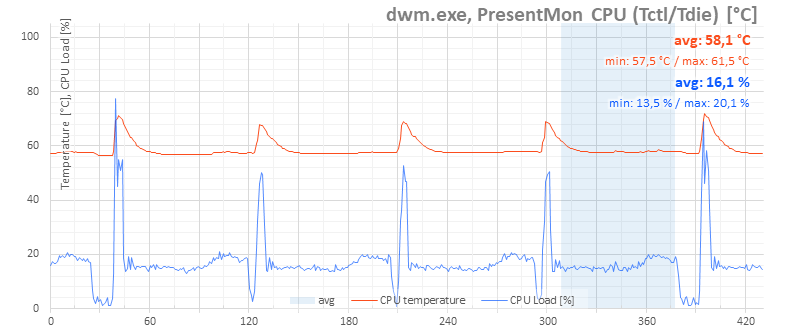
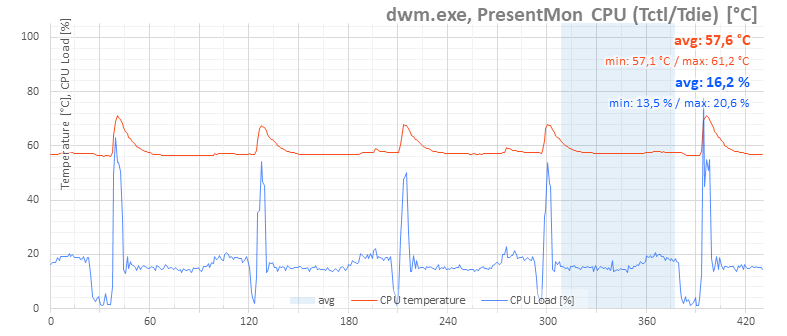
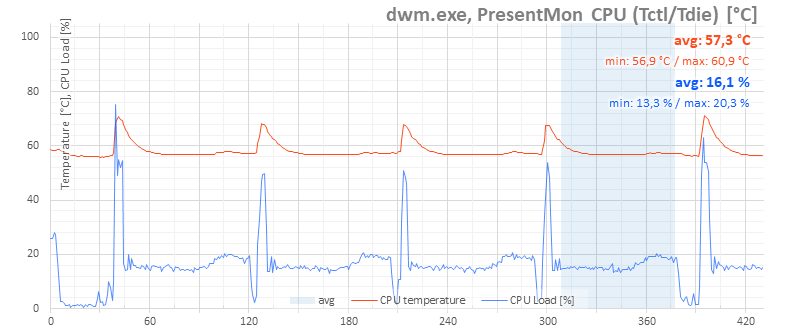
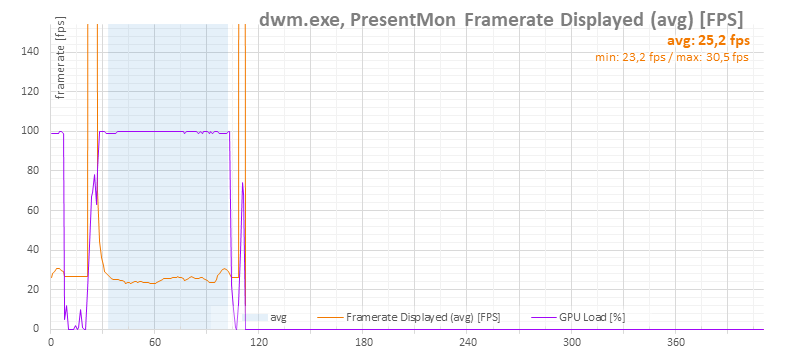
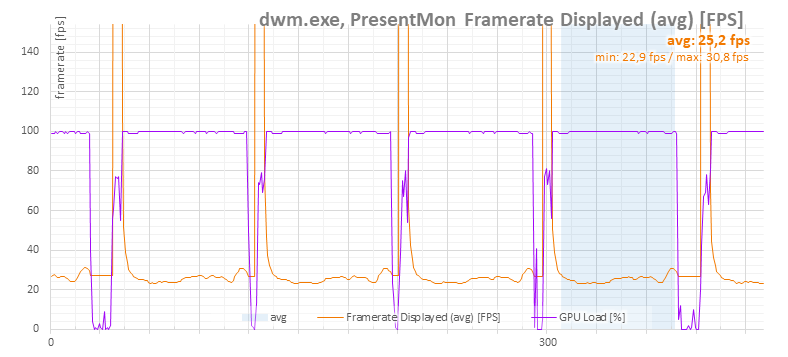
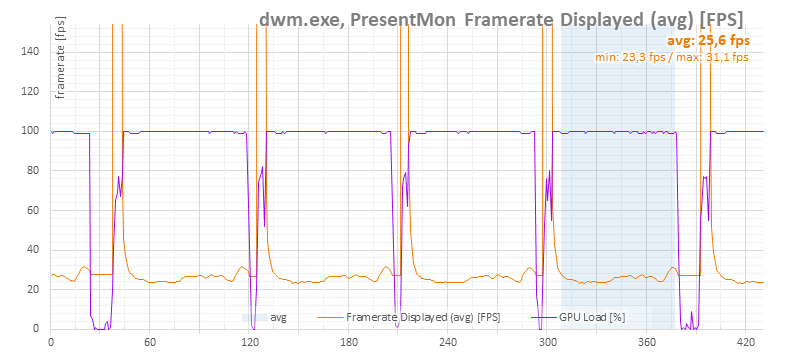
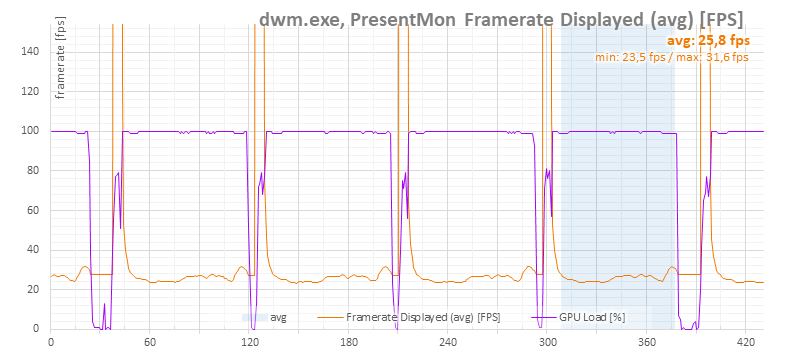
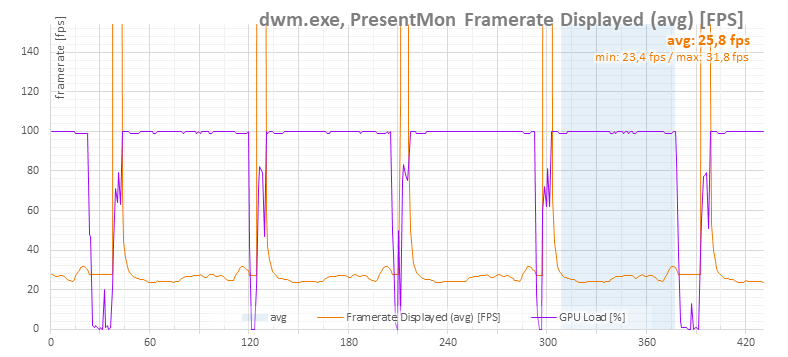
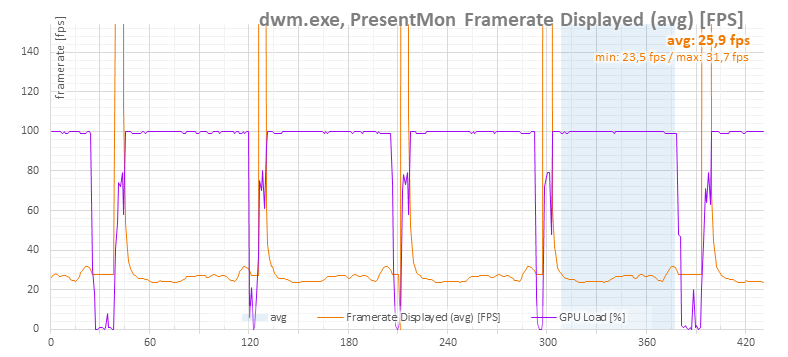
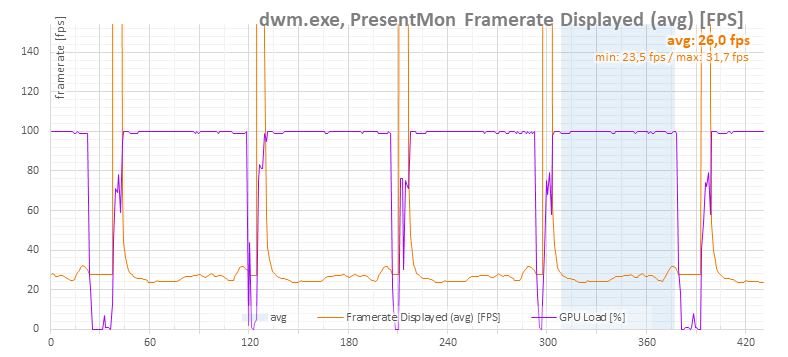
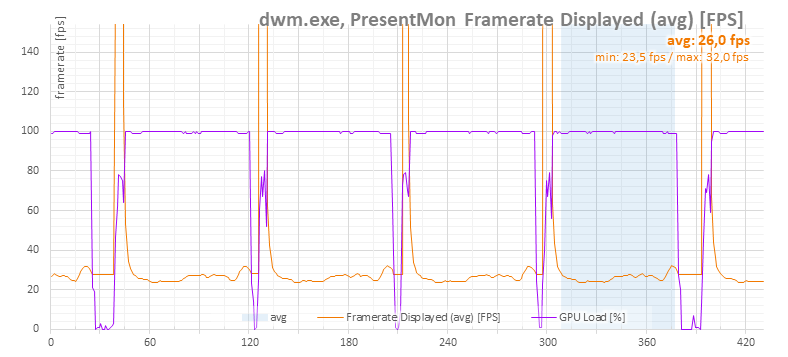
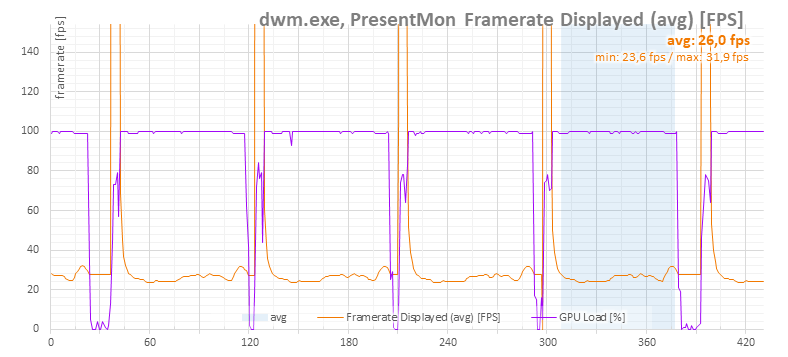
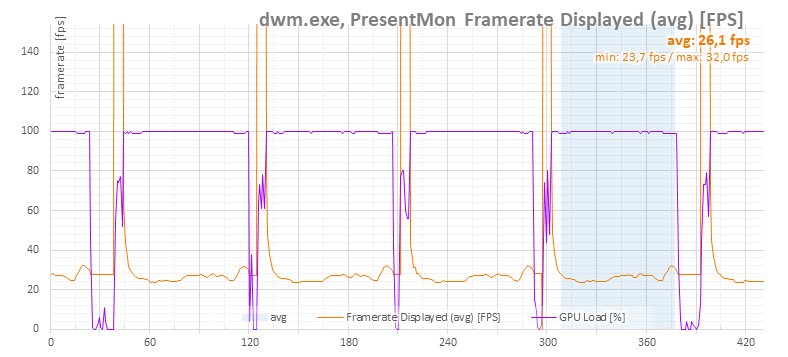
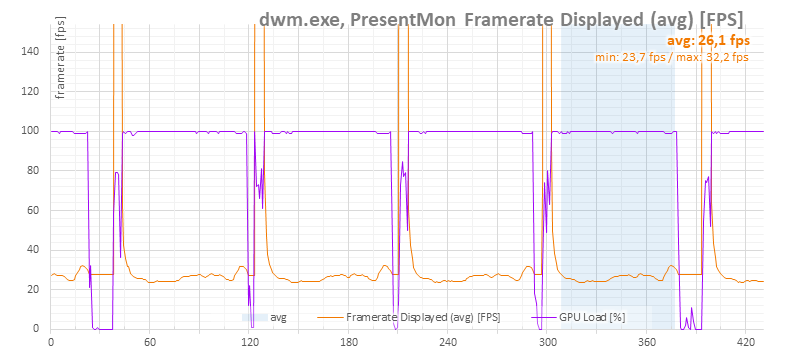
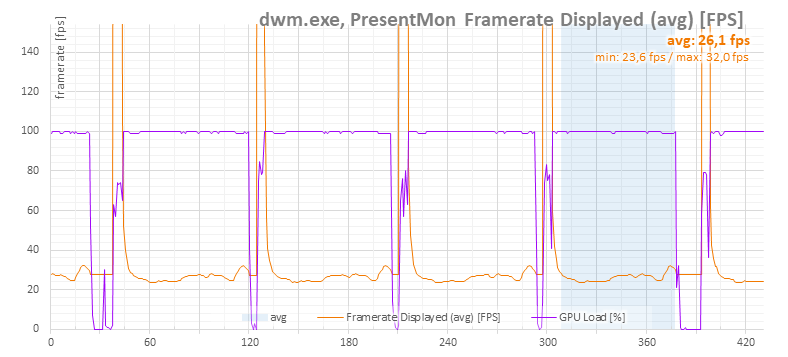
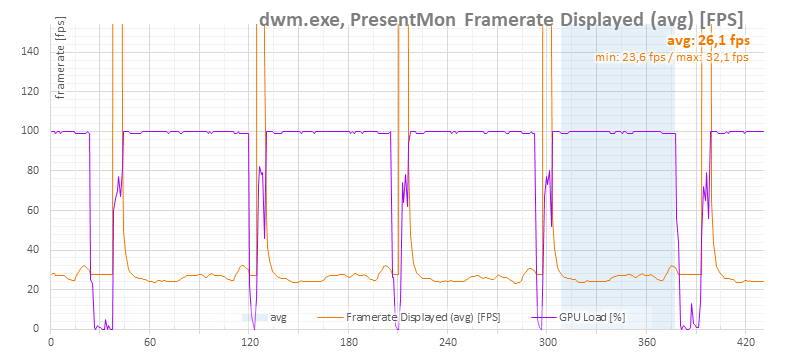
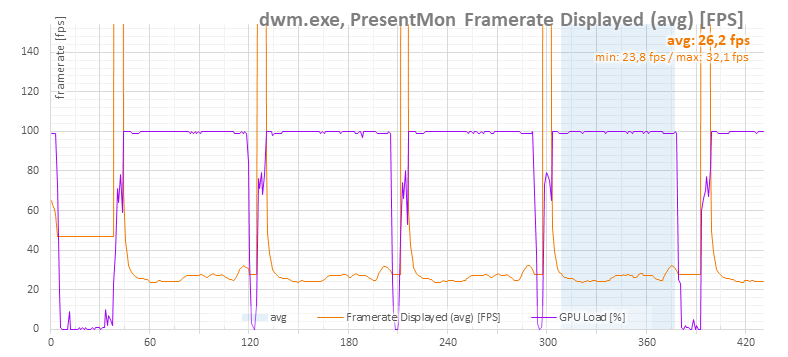
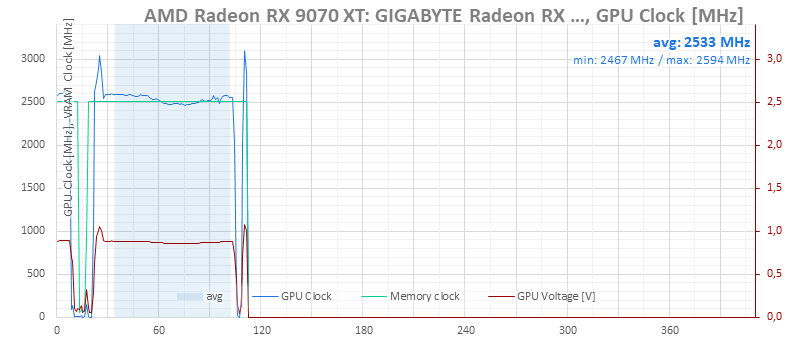
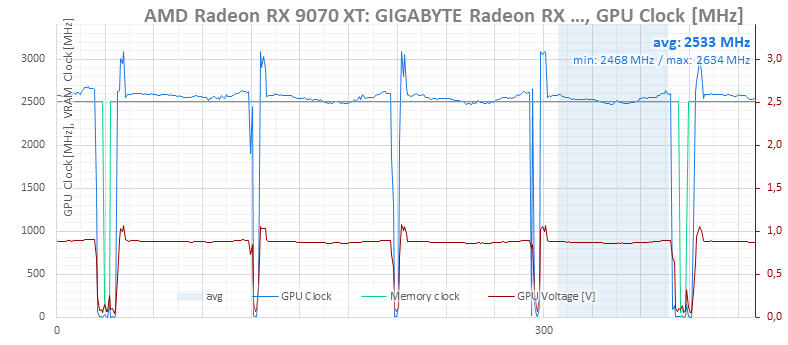
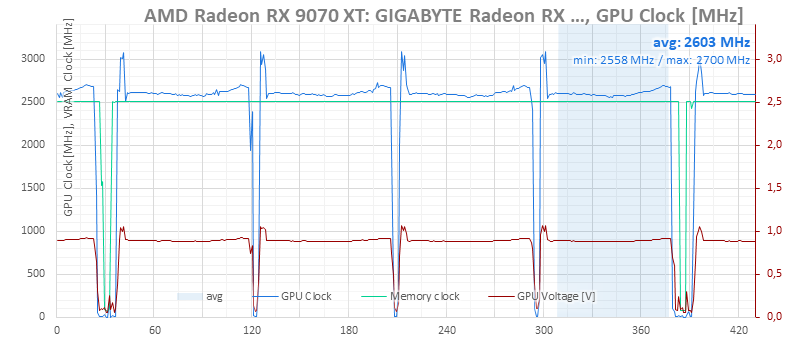
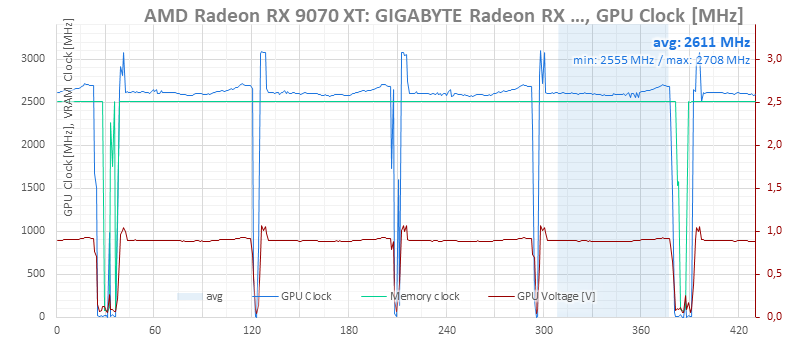
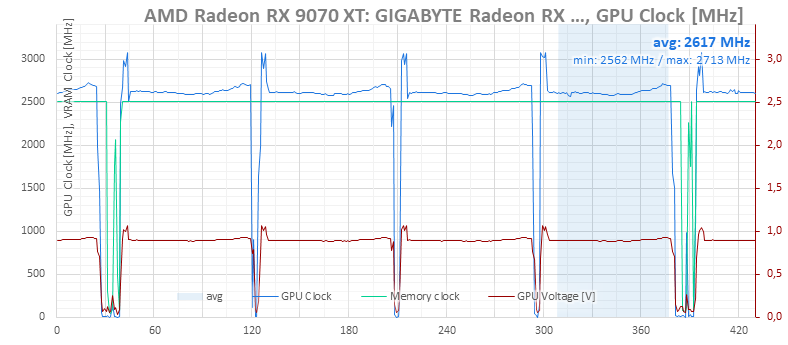
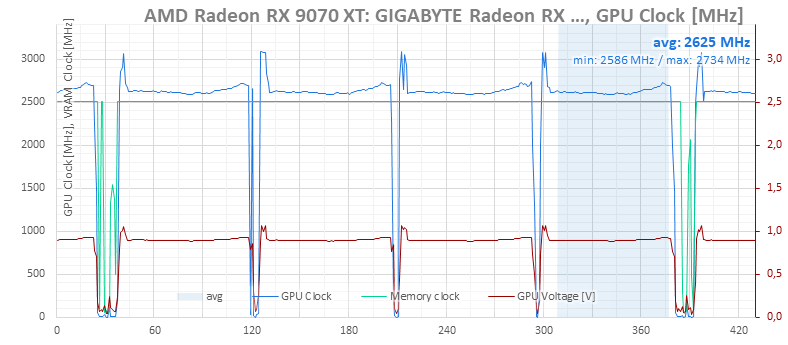
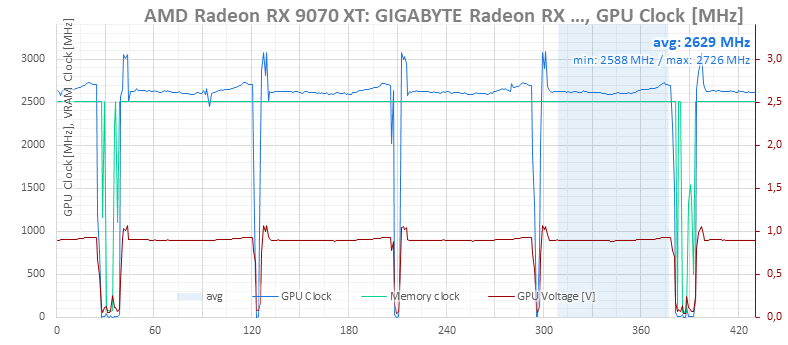
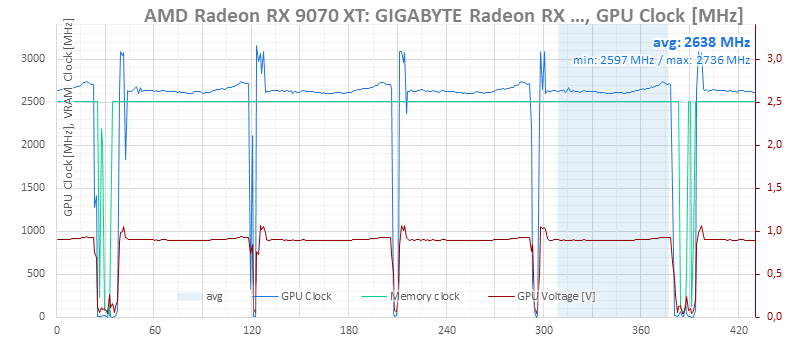
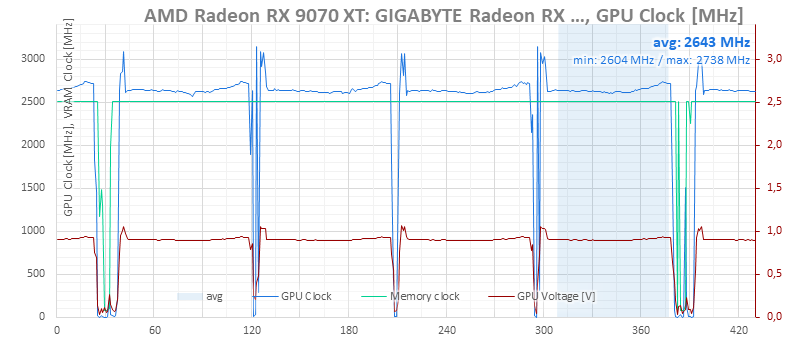
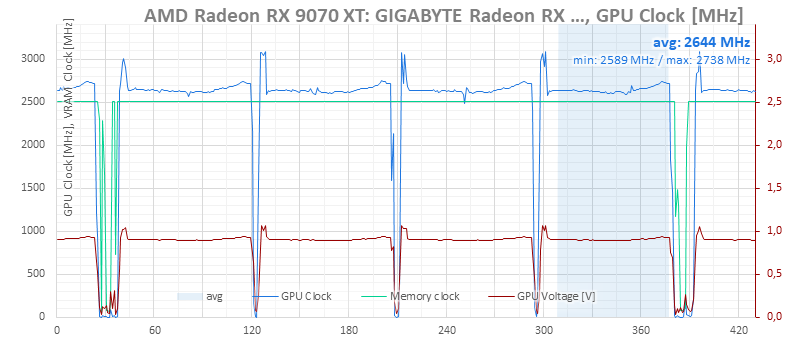
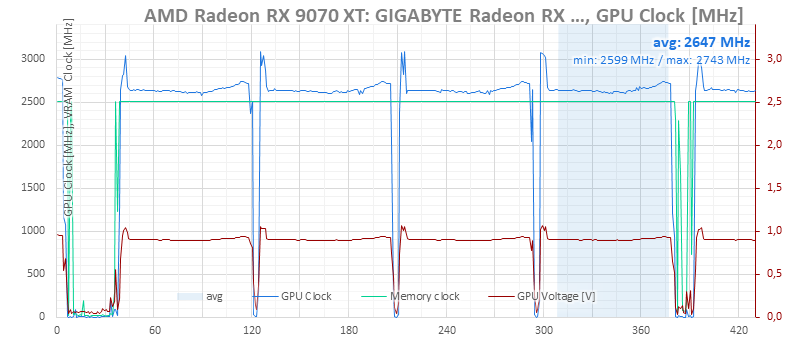
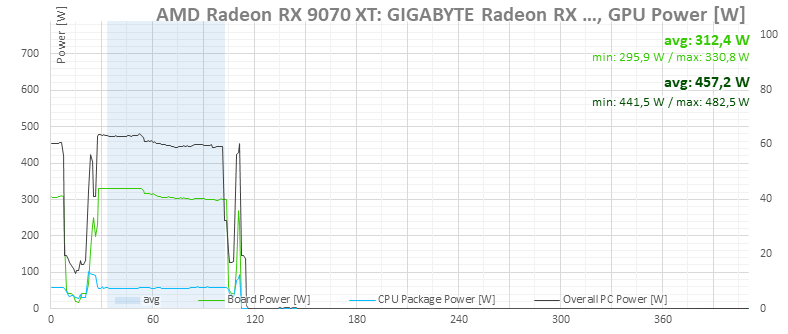
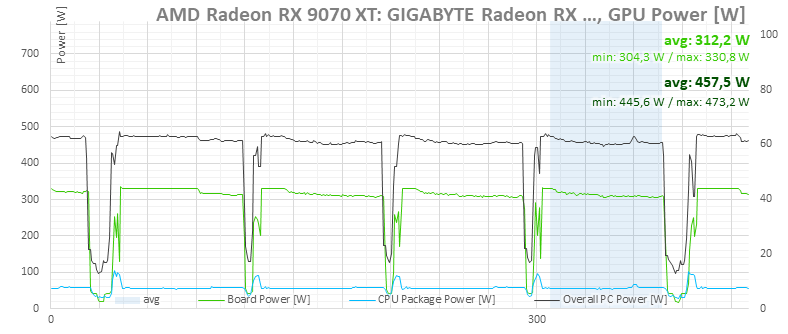
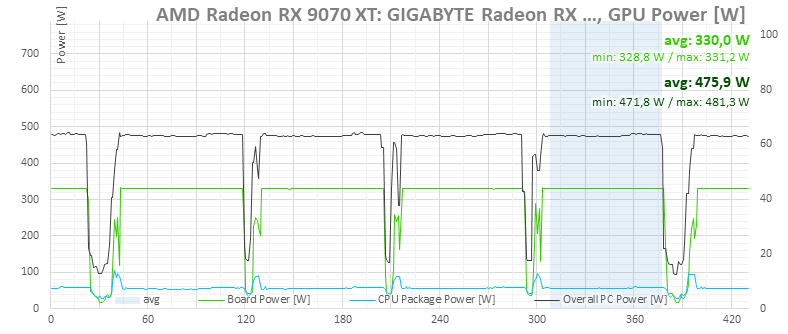
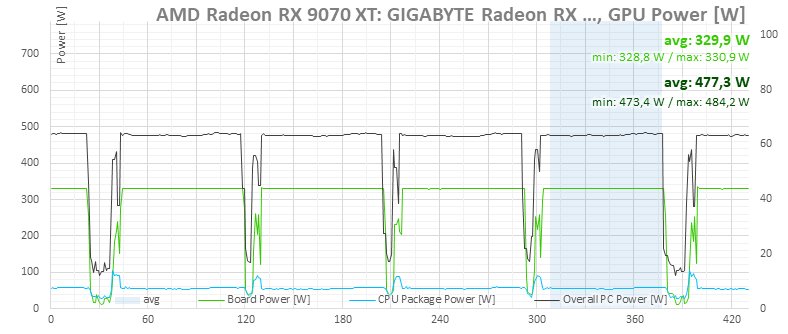
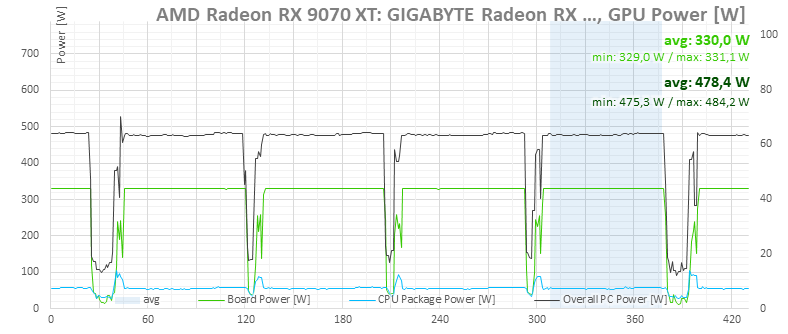
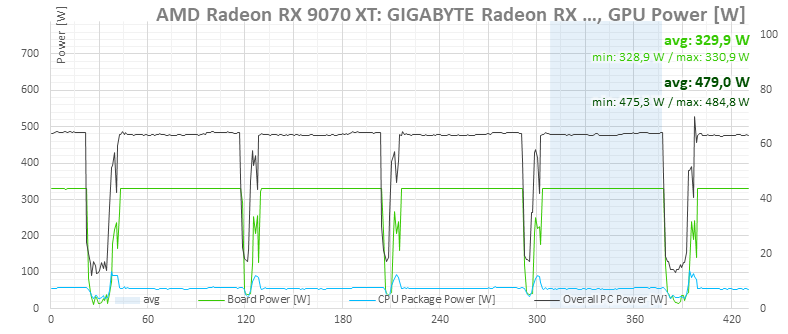
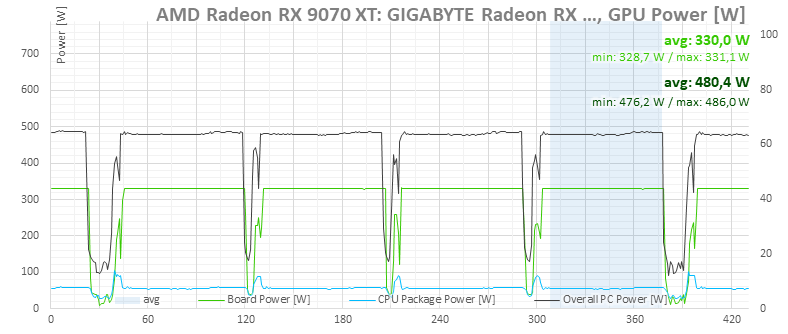
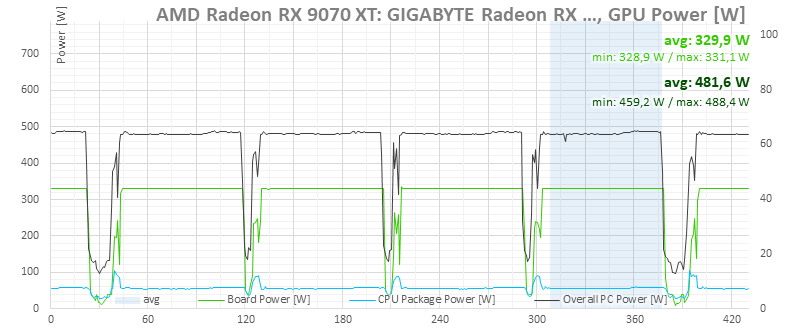
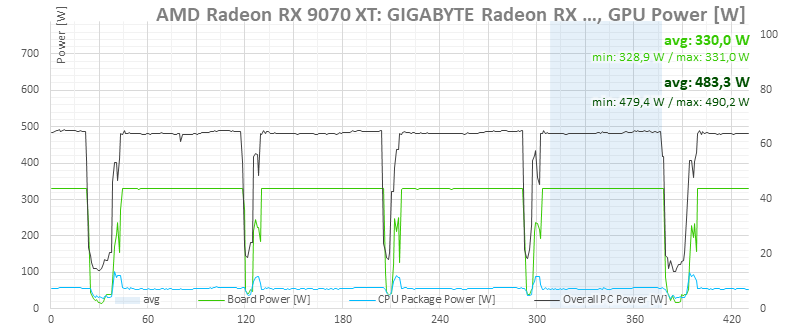
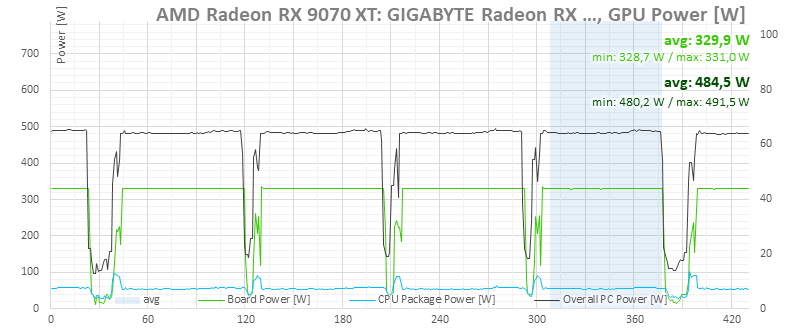
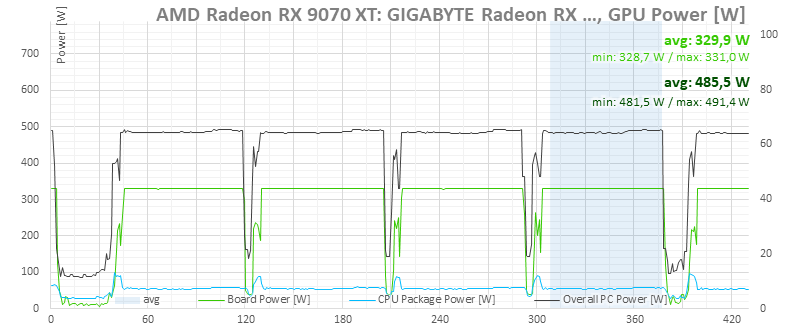
The following graphs show the detailed measurement progressions. Each one shows four runs at a single setting, with average values read from the highlighted section. When hovering over the interactive graph from left to right, the values measured within that specific fan performance range should be displayed.
If the interactive graphs do not work for you, there are also standard expandable thumbnails below them for each individual setting. These cover steps from 30% to 100% fan performance in 5% increments, with the set value also visible in the image title.
The measurement with fans at 30% performance only includes the first test run; the computer shut down before the second run due to the graphics card overheating.
















⠀