

And we come to the finale, in which we’ll look at the extremely popular line graphs that express the relationship between airflow and static pressure. These present, in a sophisticated and seemingly credible way, which fan will be more effective in which environment. As it happens, however, it is mainly a marketing tool rather than something useful that can really be relied upon.
In the previous parts of the static pressure vs. airflow series we first looked at explaining the key quantities, then followed by an analysis of the measurements of “performance for radiators”, and now we’ll explain why we don’t address P/Q curves in fan tests.
What are P/Q curves? A perfect tool for customer manipulation that has very little predictive value. With it, manufacturers (or rather marketing departments) rather egoistically operate with nested curves to present various fans in the best possible light. Models that the company wants to sell to customers for radiators or cooler heatsinks, and also those that are “supposed” to be more advantageous in system positions, for air circulation in computer cases.
Until you dig as deep into the fans as we do, it all seems to make sense, but the opposite is true. Again, what we pointed out last time applies. We don’t want to spoil anyone’s plans do any harm, but from our position we feel it appropriate to point out, with due emphasis, the facts that show why the P/Q curves cannot be taken seriously.
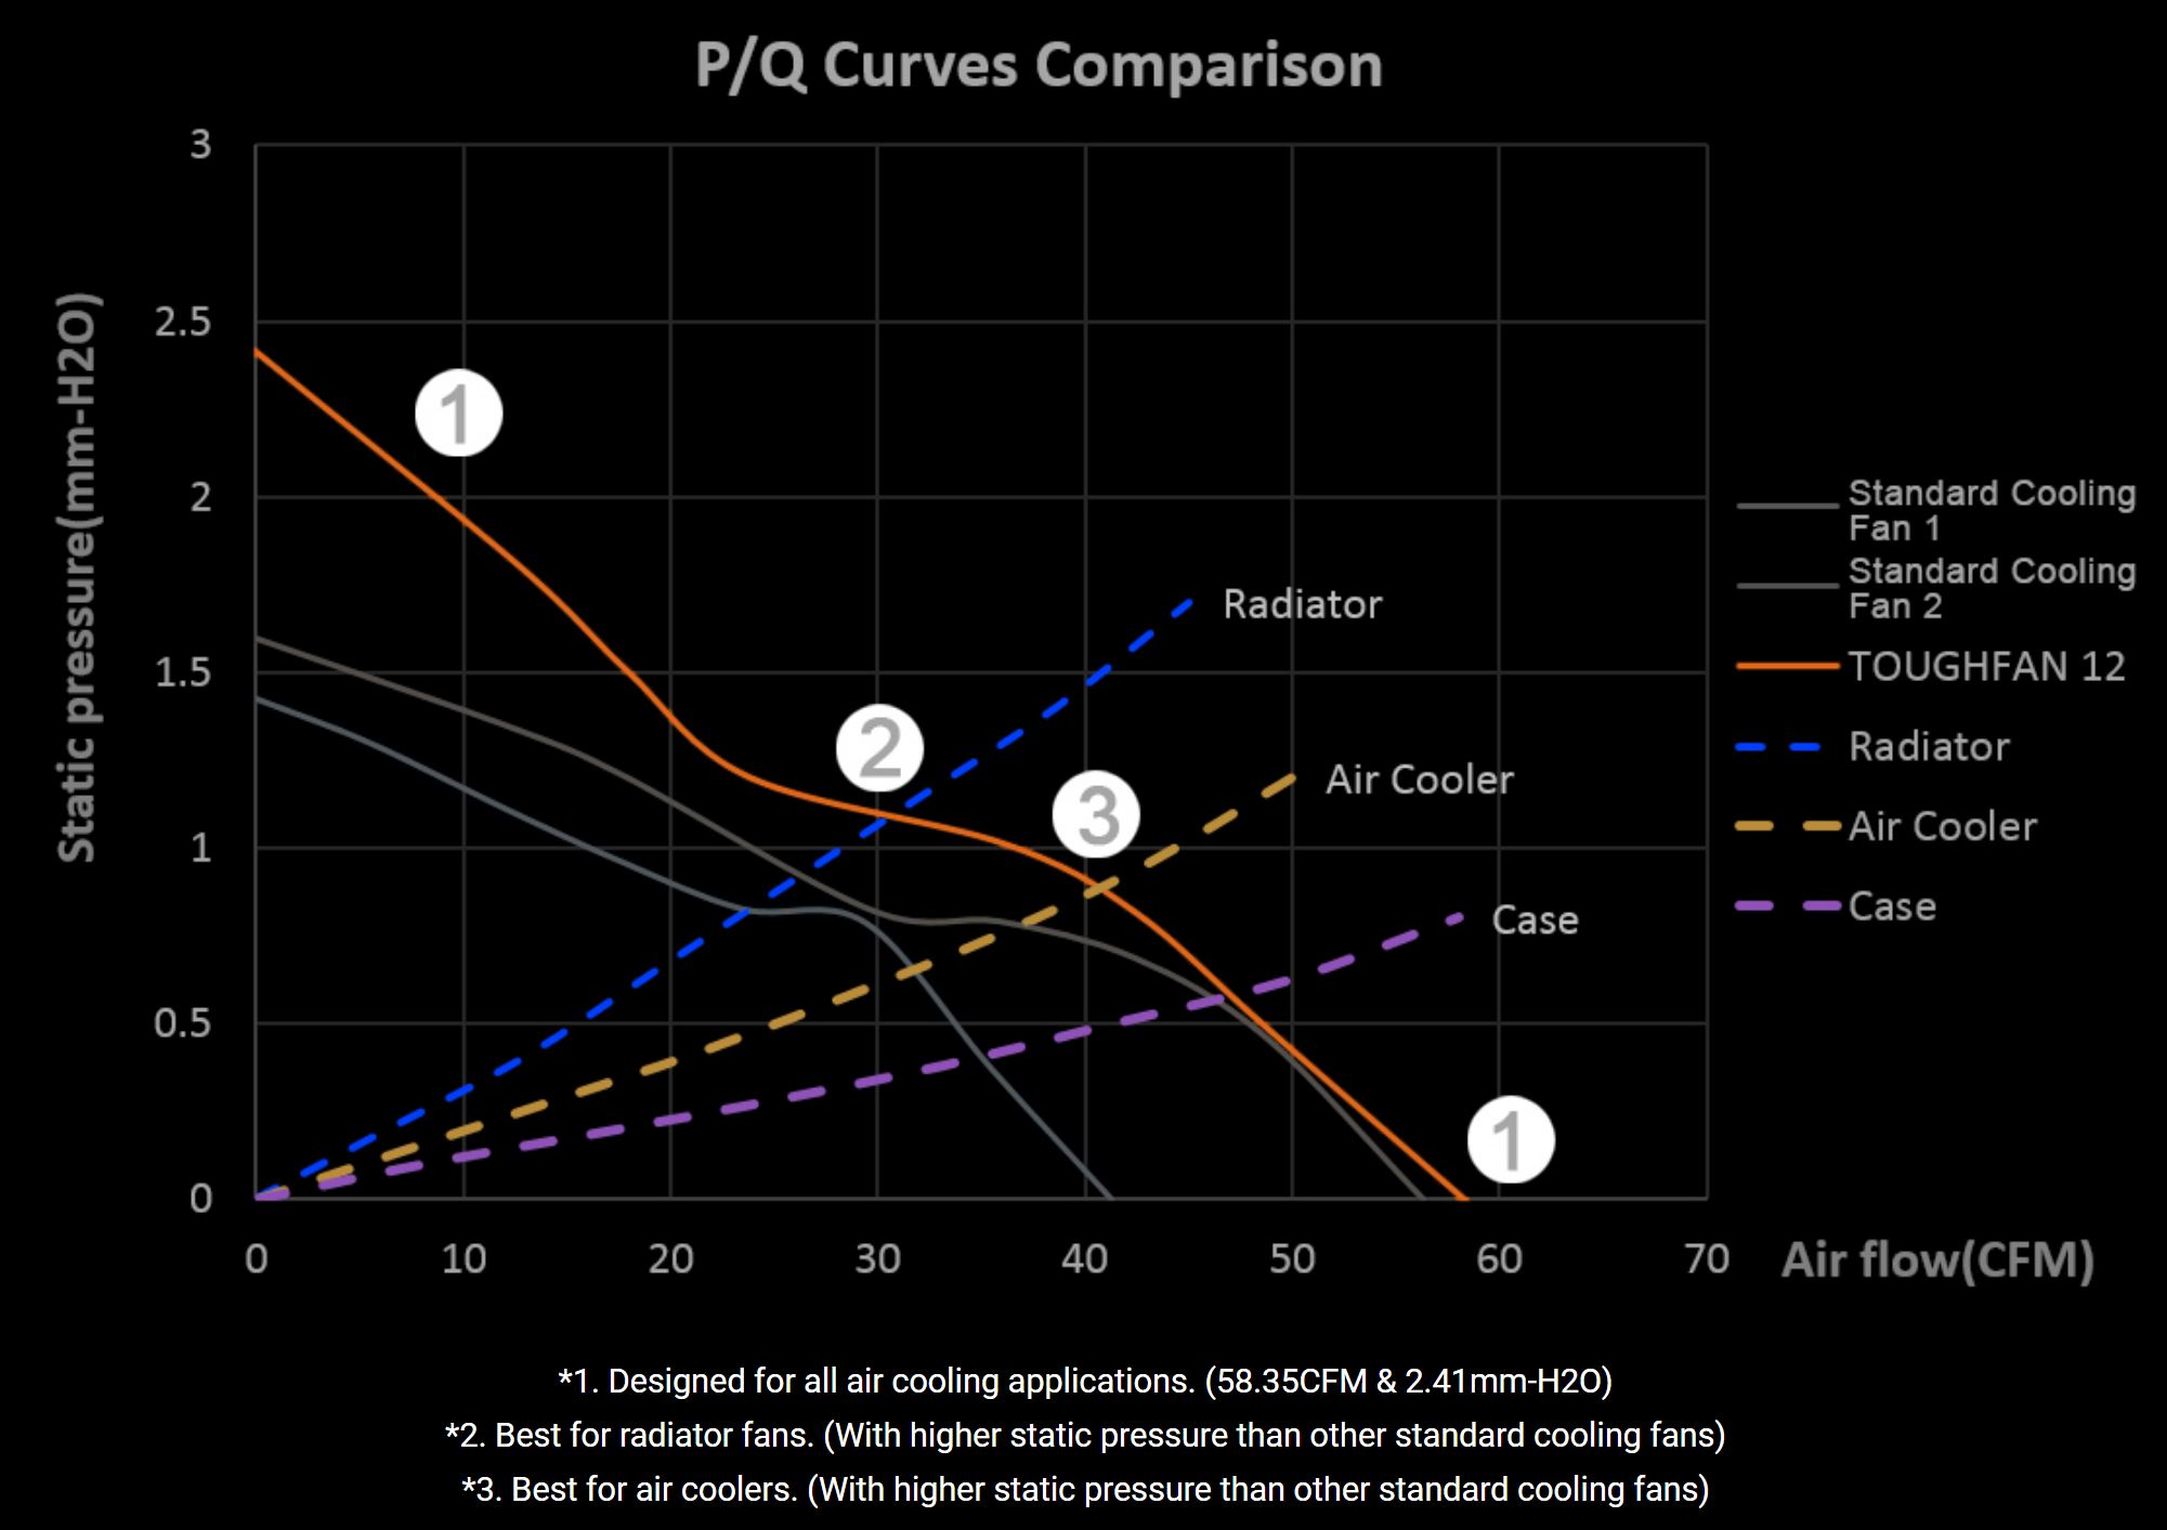
First, it is important to know what these rather complicated graphs actually capture. On the X-axis is the achieved airflow, on the Y-axis the static pressure. This is obvious to everyone, but it’s a good place to start just in case. A little more complicated to navigate is why static pressure increases with decreasing airflow and is highest at the lowest airflow. But you already know very well that static pressure is measured at zero airflow (that is, the measuring system is sealed and no air is flowing through it).
To give a better idea, a wall can be used where the fan is pushing into it but no air is pushing through it, but the static pressure is highest then. This decreases with each hole that is drilled in this wall. At the same time, more air flows through that wall. But instead of a wall, it is better to have real obstacles that are used in the computers – filters, grilles, cooler heatsinks and radiators. The manufacturers themselves work with these in their charts. There are two catches to this, however, and rather fundamental ones.
The dashed lines in the graphs, which represent individual obstacles, are based on assumptions only. Thus, they have nothing to do with actual measurements on a grille, on heatsinks, or on radiators of liquid coolers. In short, they take into account that each of these obstacles has a different “openness” rate and possibly at a different thickness, thus producing a different airflow loss at that obstacle. So for fans with higher static pressure, you can easily circle the intersection with a radiator (and mark the fan as optimal for such use), and for fans with low static pressure but high airflow (this is typically also the unfortunate Arctic BioniX F120) the intersection with a case. On the surface it all looks perfect, logically, but watch out for those two aforementioned catches. Here they come.

A case, compared to a radiator, may not present a less limiting obstacle than all fan manufacturers’ P/Q curves present. Note how, in our tests, a dust filter or a hexagonal grille reduced airflow compared to thicker radiators with thinner finning. Also for fans with relatively higher static pressure significantly more. What about those fans “best for a case” then? Those have a lot of trouble with filters and grilles.
Again, we bring the Arctic BioniX F120 to your attention as a prime example, which has top-notch efficiency only without an obstacle. Even a dust filter causes great difficulties for this and many similar fans, design-wise. A “case” can only be considered the least limiting obstacle if it has no filters or grilles. Otherwise, the filter and grilles will eat up the fan airflow considerably more than a liquid cooler radiator. So, in practice, it’s all reversed. Further, it is also unclear from these curves what designs represent “air coolers” (of which there are tons) and what designs represent “radiators”? There is too much variation in fin densities (FPI) and thicknesses for radiators to be represented by one universal curve.
Moreover, as you already know from the last part of this series, the key for radiators is not how much dynamic pressure drop they cause, but what the total pressure is at their level, at the points of the obstacle. Not around it. Information on what the measurable airflow loss is is useful in taking into account how the fan on the radiator contributes to system cooling. How efficiently the radiated heat is removed from the fins says is expressed by something else, however, and the P/Q curves just estimate that based on dynamic and static pressure (measured at zero flow, to which even the densest and thickest radiator won’t stifle the fan), and they estimate it rather imprecisely.
Without measurements on a physical obstacle, it is also impossible to conclude that a fan with higher static pressure must mean less airflow loss through the obstacle. Also important to the final result is the nature of the turbulent flow and how effectively it mixes warm molecules with cold ones. But that is beyond the scope of what was the purpose of this series. Anyway, it’s much, much more complicated than fan manufacturers make it out to be. And they know it well, we know it, you know it.
English translation and edit by Jozef Dudáš