perex
Deshroud with 2× Noctua NF-A14x25 G2 PWM Sx2-PP
The operational speed range is smaller than that of the original Axial-tech fans. The measured noise level at the same fan speeds is significantly lower. However, the fans blow air in all directions, and with the fin stack covered, the card will likely be somewhat louder.
At 10% PWM duty cycle, they run at 308 RPM. The noise level remains so low up to approximately 750 RPM that it’s beyond the measuring range of the sound level meter. The fans have a maximum speed of 1540 RPM (or 1480 RPM for the slower of the two fans).

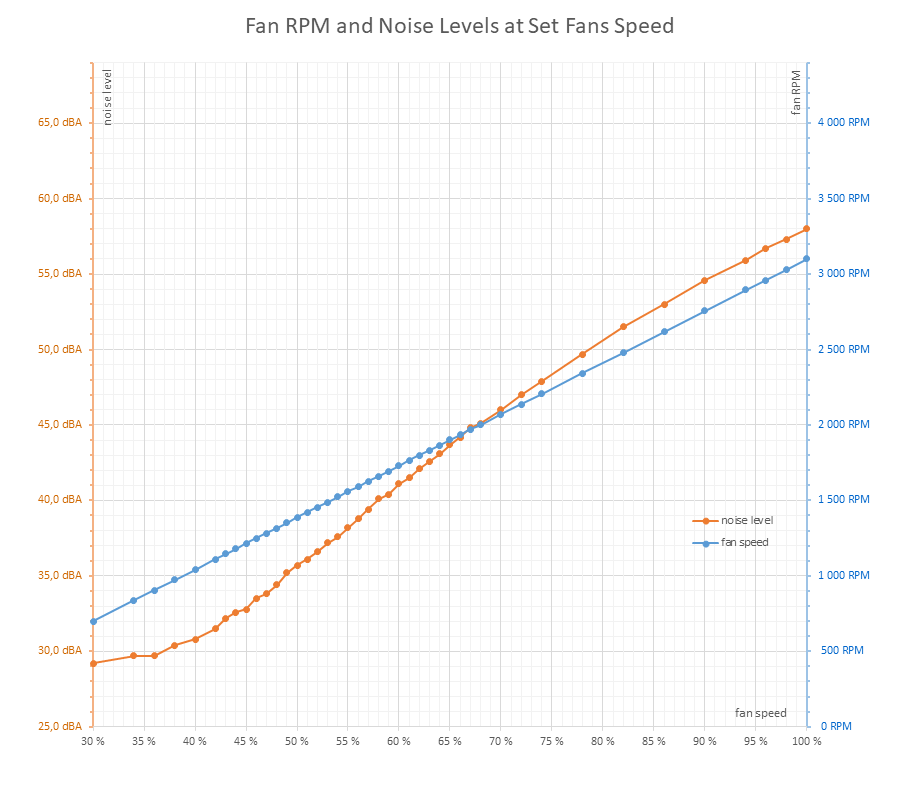
2× Noctua NF-A14x25 G2 | 3× Asus Axial-tech Fan
Manual Fan Speed from 20 % to 100 %, step 5 %
I will measure how the card’s operational characteristics change across the entire range of fan performance
Due to time constraints, I will use short loops of the Cyberpunk benchmark with the RT Medium profile and a resolution of 3840 × 2160 with DLAA. Before the entire batch, one warm-up loop runs with four passes and the fans set to 45% performance. The graphs below have the warm-up loop filtered out; they start with the first measurement with the fans set to 20% performance. Going lower than this is usually pointless because at low fan speeds and GPU temperatures over 85 °C, the regulation begins to significantly throttle the GPU’s power draw and, with it, the clock speeds and performance.
The fan performance is then gradually increased from 20% to 100% in 5% steps. With each setting, four test loops are run. The delays between individual test runs are only a few seconds, so the system remains heated during testing. I will read the measured values from the fourth run, or exceptionally from the third if there is any issue with the last measurement.
First, let’s look at the summary graph with values measured using the pair of Noctua NF-A14x25 G2 fans across their entire performance range. These are just simple images; detailed results for individual settings can be found in the interactive graphs in the next chapter.
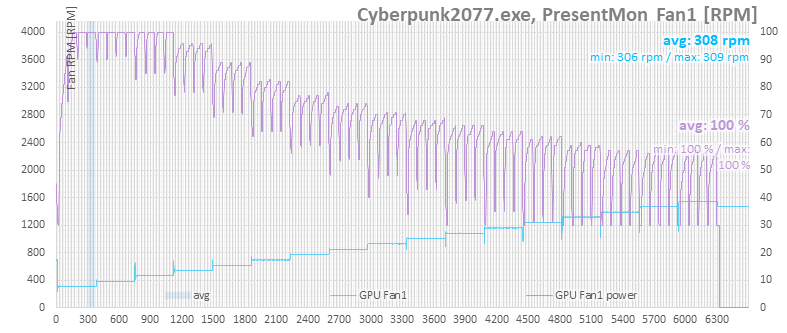
With the lowest fan performance at 20%, corresponding to a low 308 RPM, the average chip temperature already reaches peaks of 90 °C—the temperature limit. Because of this, the regulation begins to significantly reduce the chip’s power consumption to prevent it from heating so much.

On the purple curve, we again see what fan performance the automatic regulation in the card’s BIOS would set. This does not correspond to the actual fan speeds because they are not connected to the card; instead, we regulate their speed externally. The automatic regulation tries to set the maximum fan performance at 20%, 25%, and 30%. At 35% fan performance, the temperature no longer reaches the critical value.
The next graph shows the processor temperatures. Ignoring the beginning, where probably not all components inside the case are fully heated yet, from roughly 35% fan performance onwards, it’s visible that their higher speeds also contribute to better processor cooling.

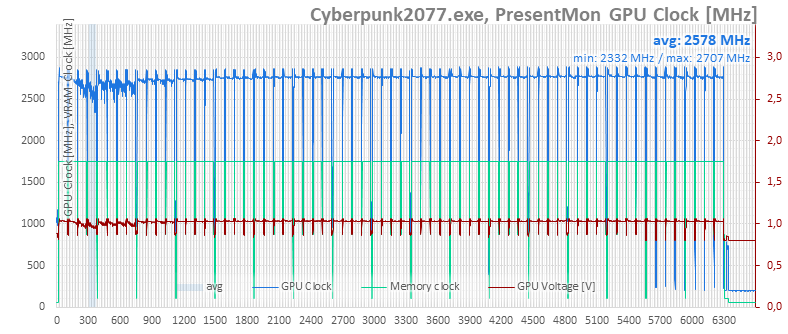
In the graphs showing GPU clock speeds, it’s evident that at low fan speeds, the cooler’s performance is low, the card hits thermal limits, and reduces the chip’s clock speeds and voltage, along with its power consumption. Starting with the fourth setting at 35% fan performance, significant drops are no longer visible. Subsequently, with a cooler chip, the performance increases only marginally.
The lower performance is measurable mainly in the first few runs; later, with higher fan speeds, it improves by only a few tenths of a frame per second each time.

The power draw graph clearly shows how the regulation’s interventions in clock speeds and voltage, due to high chip temperatures, are reflected in the card’s power.

And the last image also illustrates the limits that were active at any given moment—you can see that the regulation only acknowledges reaching the temperature limit in the first run, even though in the second run with the fans at 20%, it intervenes in the clock speeds more aggressively than at higher fan speeds.

⠀