Last week, we took a look at the Asus ROG Astral GeForce RTX 5080 OC Edition. It has a powerful cooler, but by default, the fan control pushes speeds high, and card is anything but quiet. So, I also measured how the card’s behavior changes when lowering fan speeds, how different power limit settings affect performance, and what the OC scanner does to the clock speed/voltage curve and how that impacts performance.
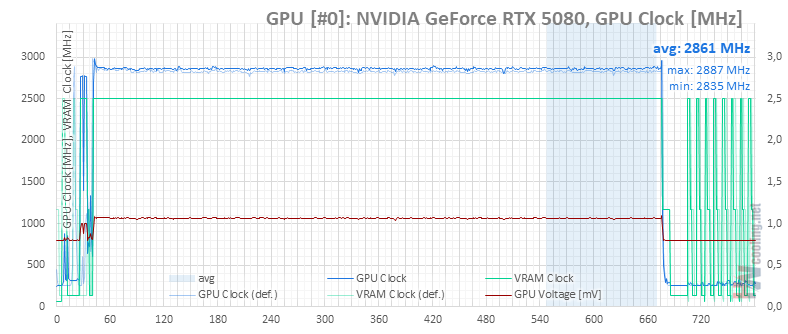
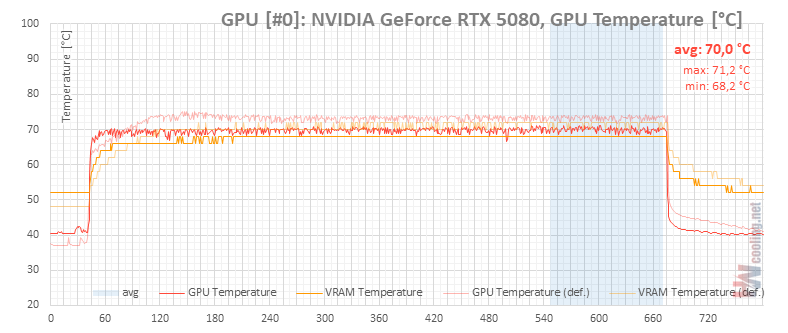
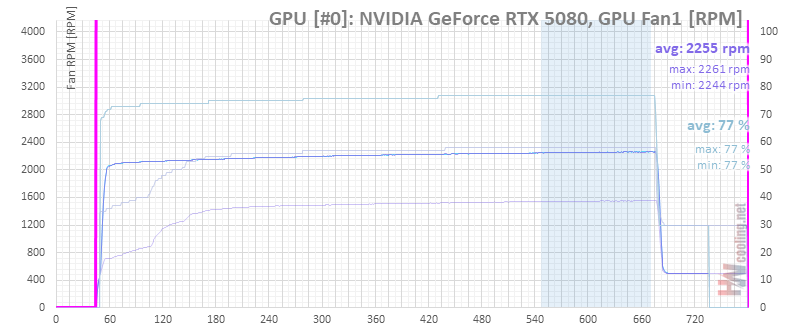
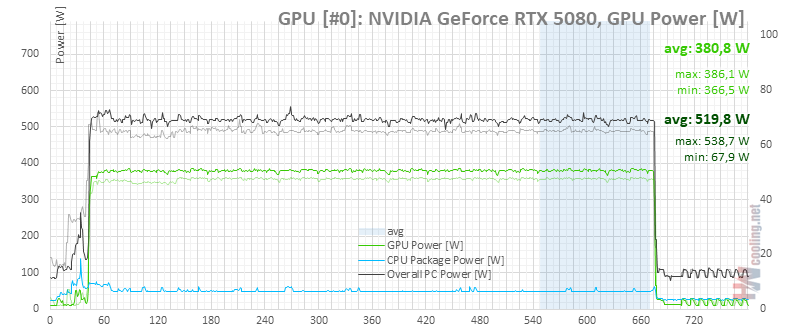
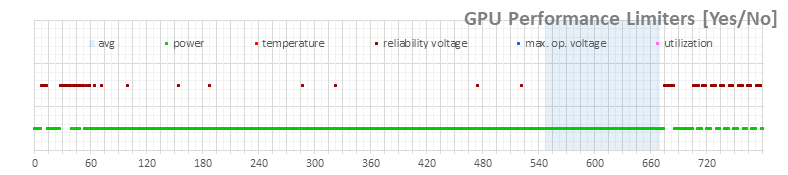
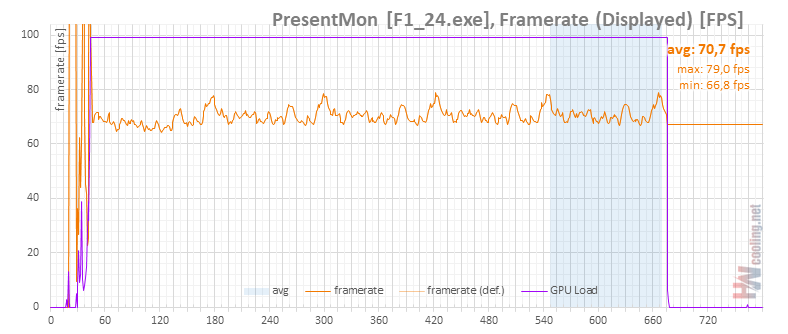
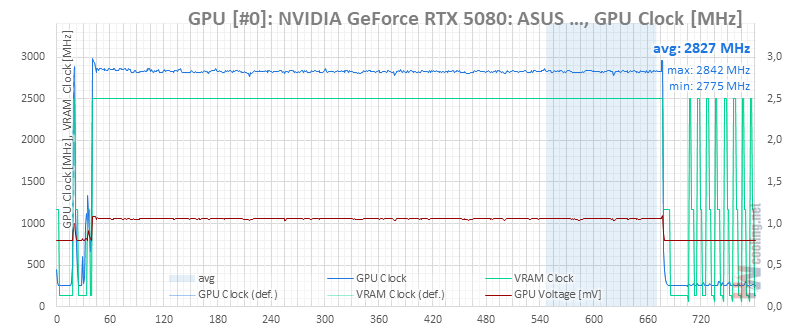
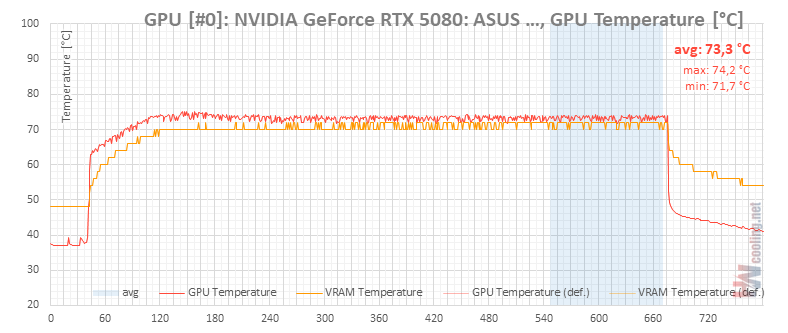
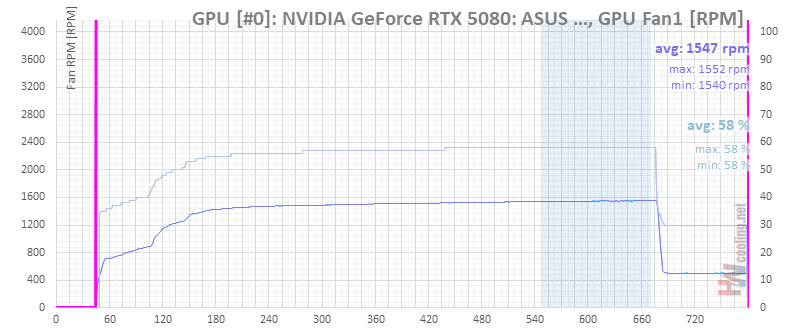
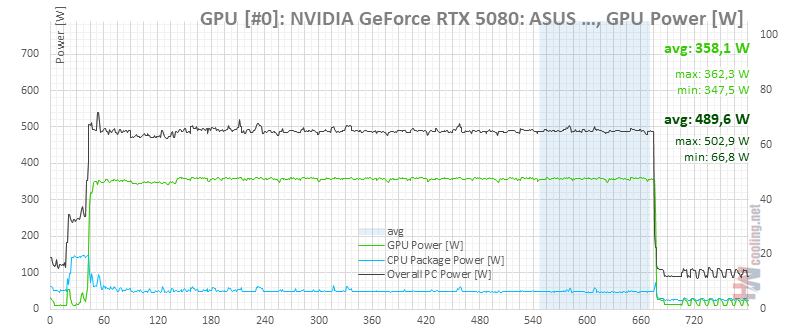
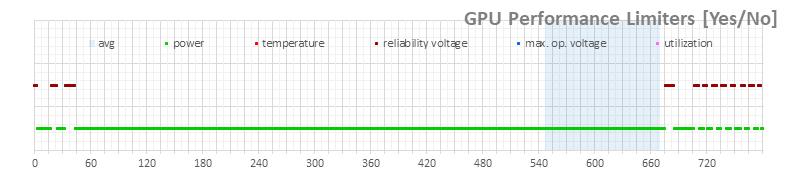
There can be multiple data lines in the graphs. Values are plotted on the vertical axes, time in seconds on the horizontal axis. In each graph, a pale blue bar indicates the section from which the average performance is calculated and the minima and maxima are taken.
In the case of this article, it’s the entire run through the last lap of the F1 24 benchmark.

On the following pages, the measurements with the default settings will be shown along with the relevant measurements for comparison. The lines with default values will be fainter in the graph, they have 60% opacity.
To begin with, let’s review the behavior of the card under default settings.
Default settings, BIOS Performance
In the first graph, the frame rate curve is in orange. In purple is the graphics chip utilization, which is consistently at 99 %. With RTX 50, however, this figure is probably not very reliable yet.
Default settings, BIOS Quiet
⠀