


Even with two fans, this cooler is a very good option. Compared to similar and typically cheaper designs with four heatpipes, it can handle significantly higher loads. This is true on both the latest Intel platform (LGA 1851) and AMD Ryzen 9000 processors (AMD AM5). There is also a certain benefit to these things around cooling performance in mounting via a custom retention bracket (ILM) around the processor socket.
Testing methodology
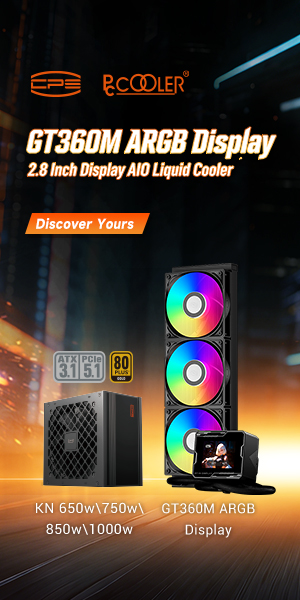
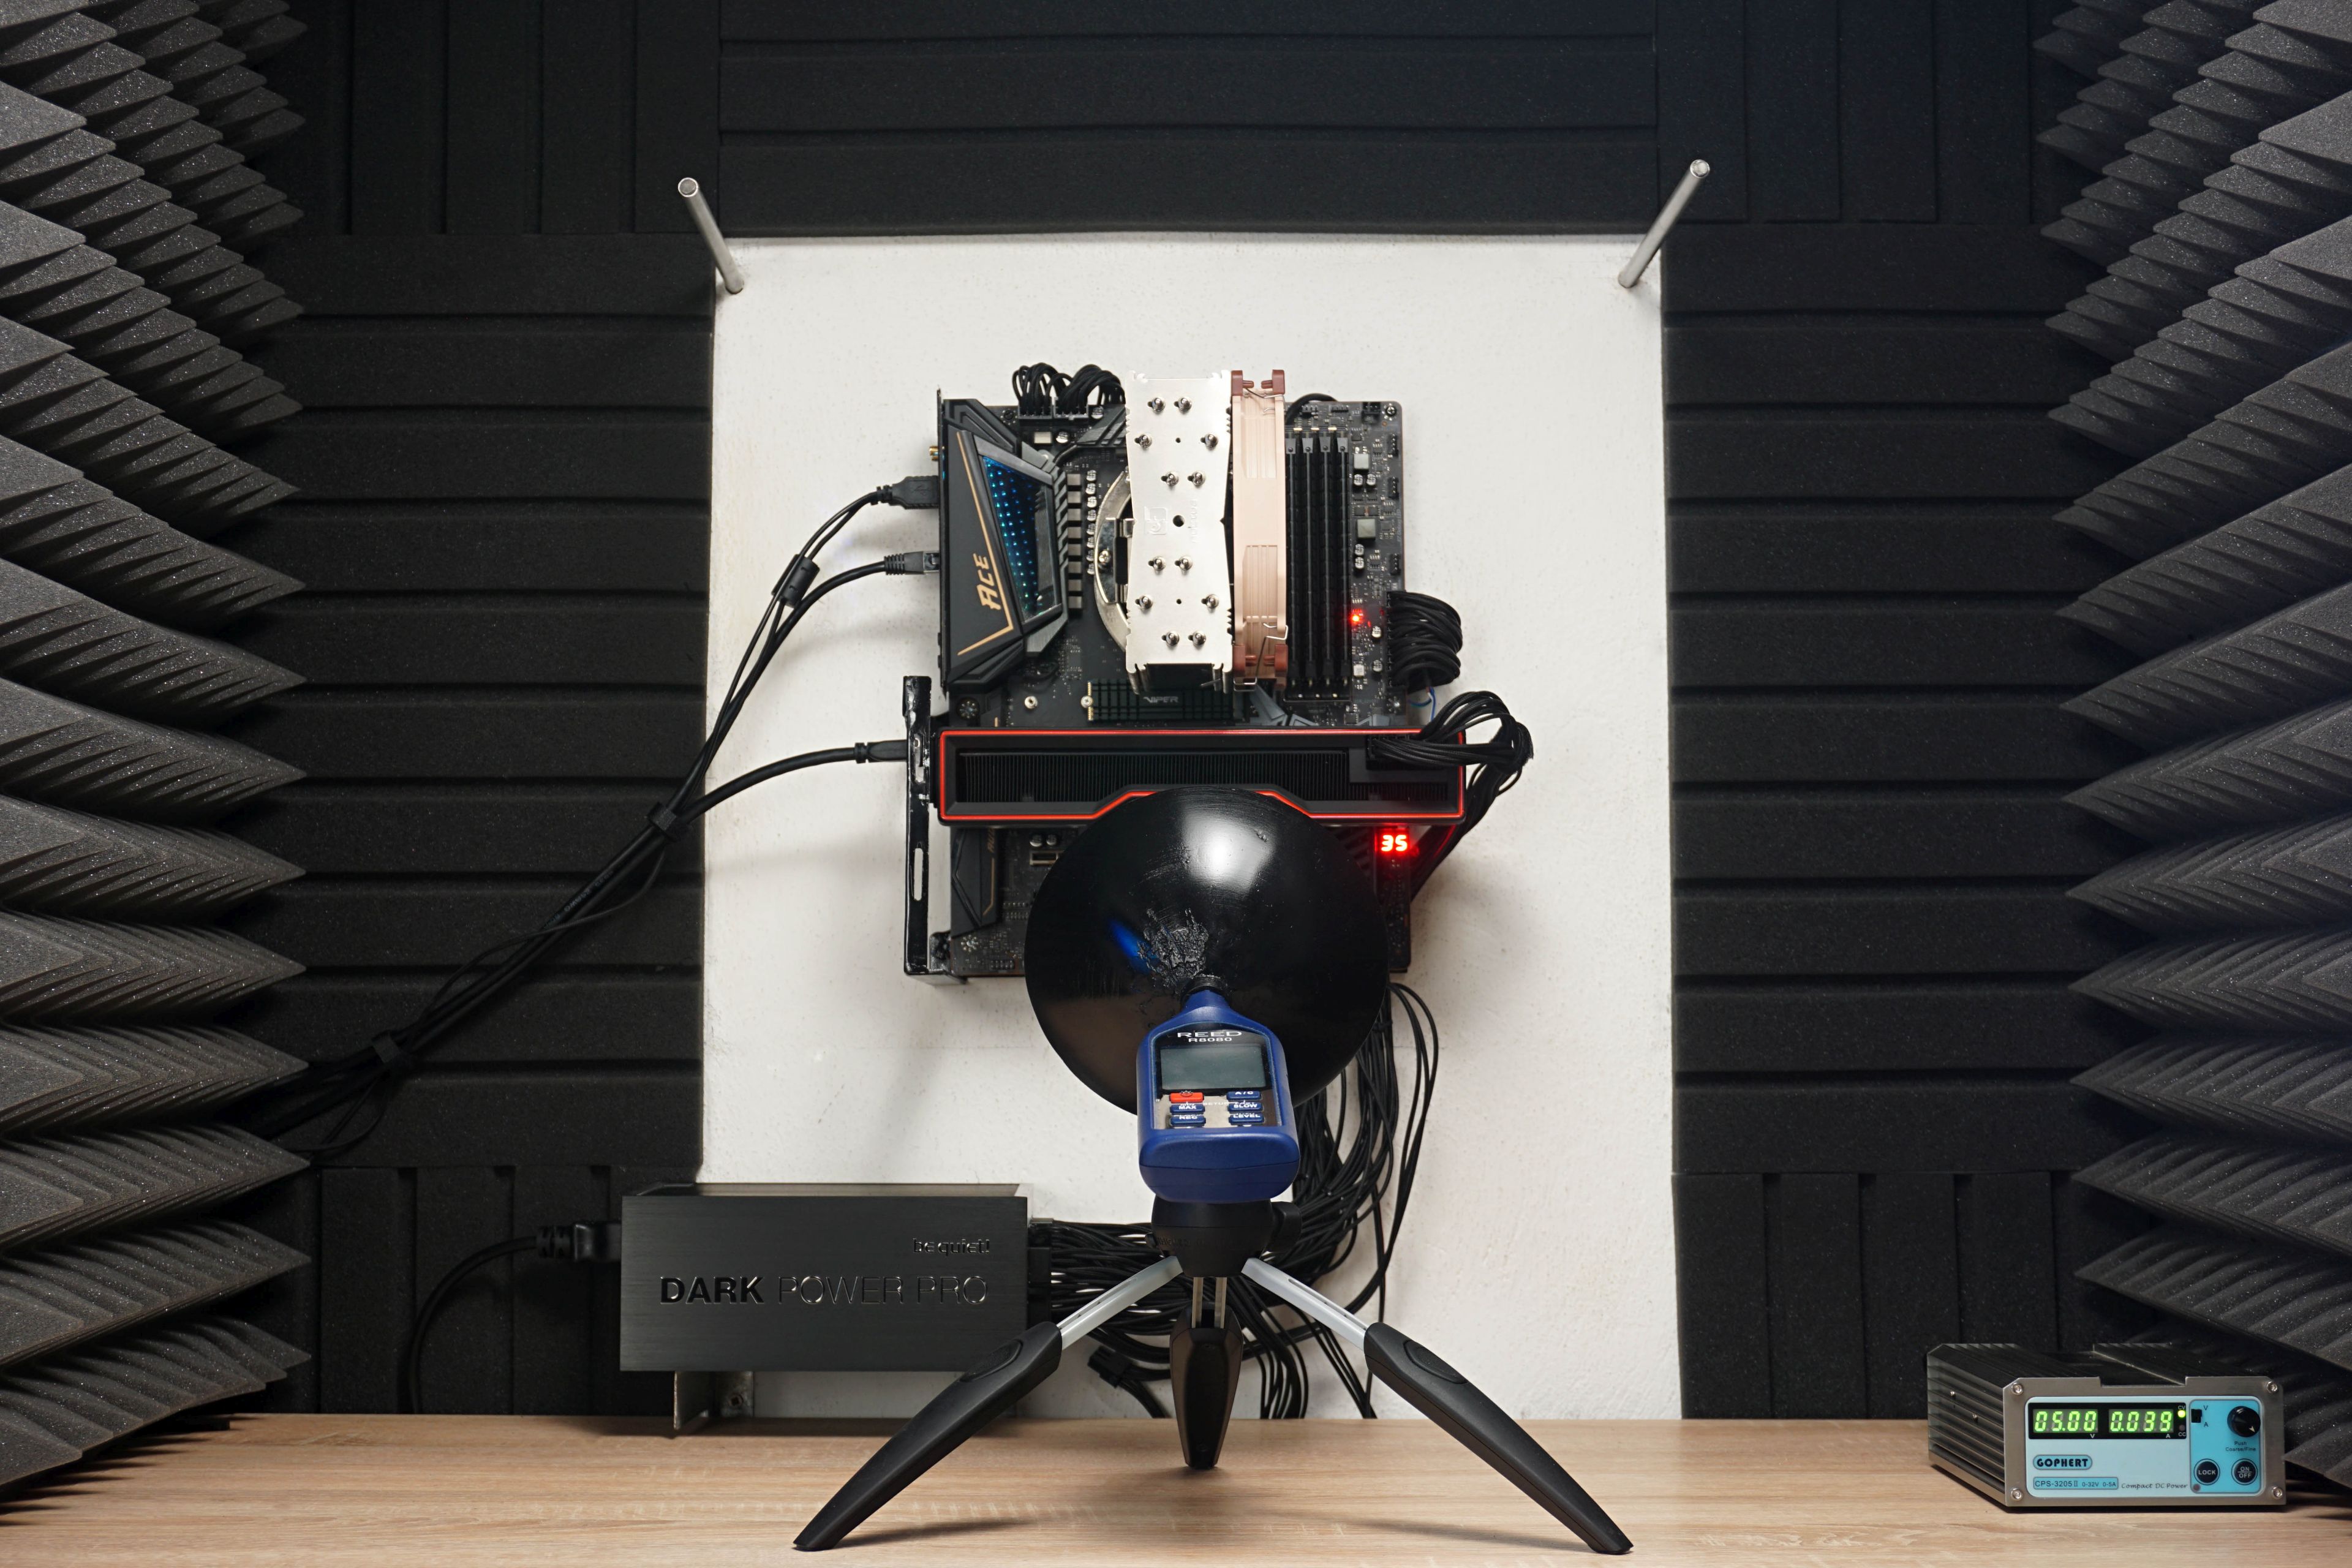
Performance tests of CPU coolers are performed in our wind tunnel. This mimics a medium-sized computer case with four system fans, two 120mm models being intake fans and the same number being outtake fans. The fans used are Noctua NF-S12A PWM, slowed down to 550 rpm. All of them. This means that the air flow in the tunnel, or in the case, is in equilibrium. Such a configuration has also proven itself in tests aimed at exploring different positions (and settings) of system fans with regard to efficient cooling of a build as a whole.
In AIO liquid cooler tests, only three Noctua NF-S12A PWM fans are installed. The top one is dropped here at the expense of the cooler itself, which we install in the ceiling position of the case (tunnel).
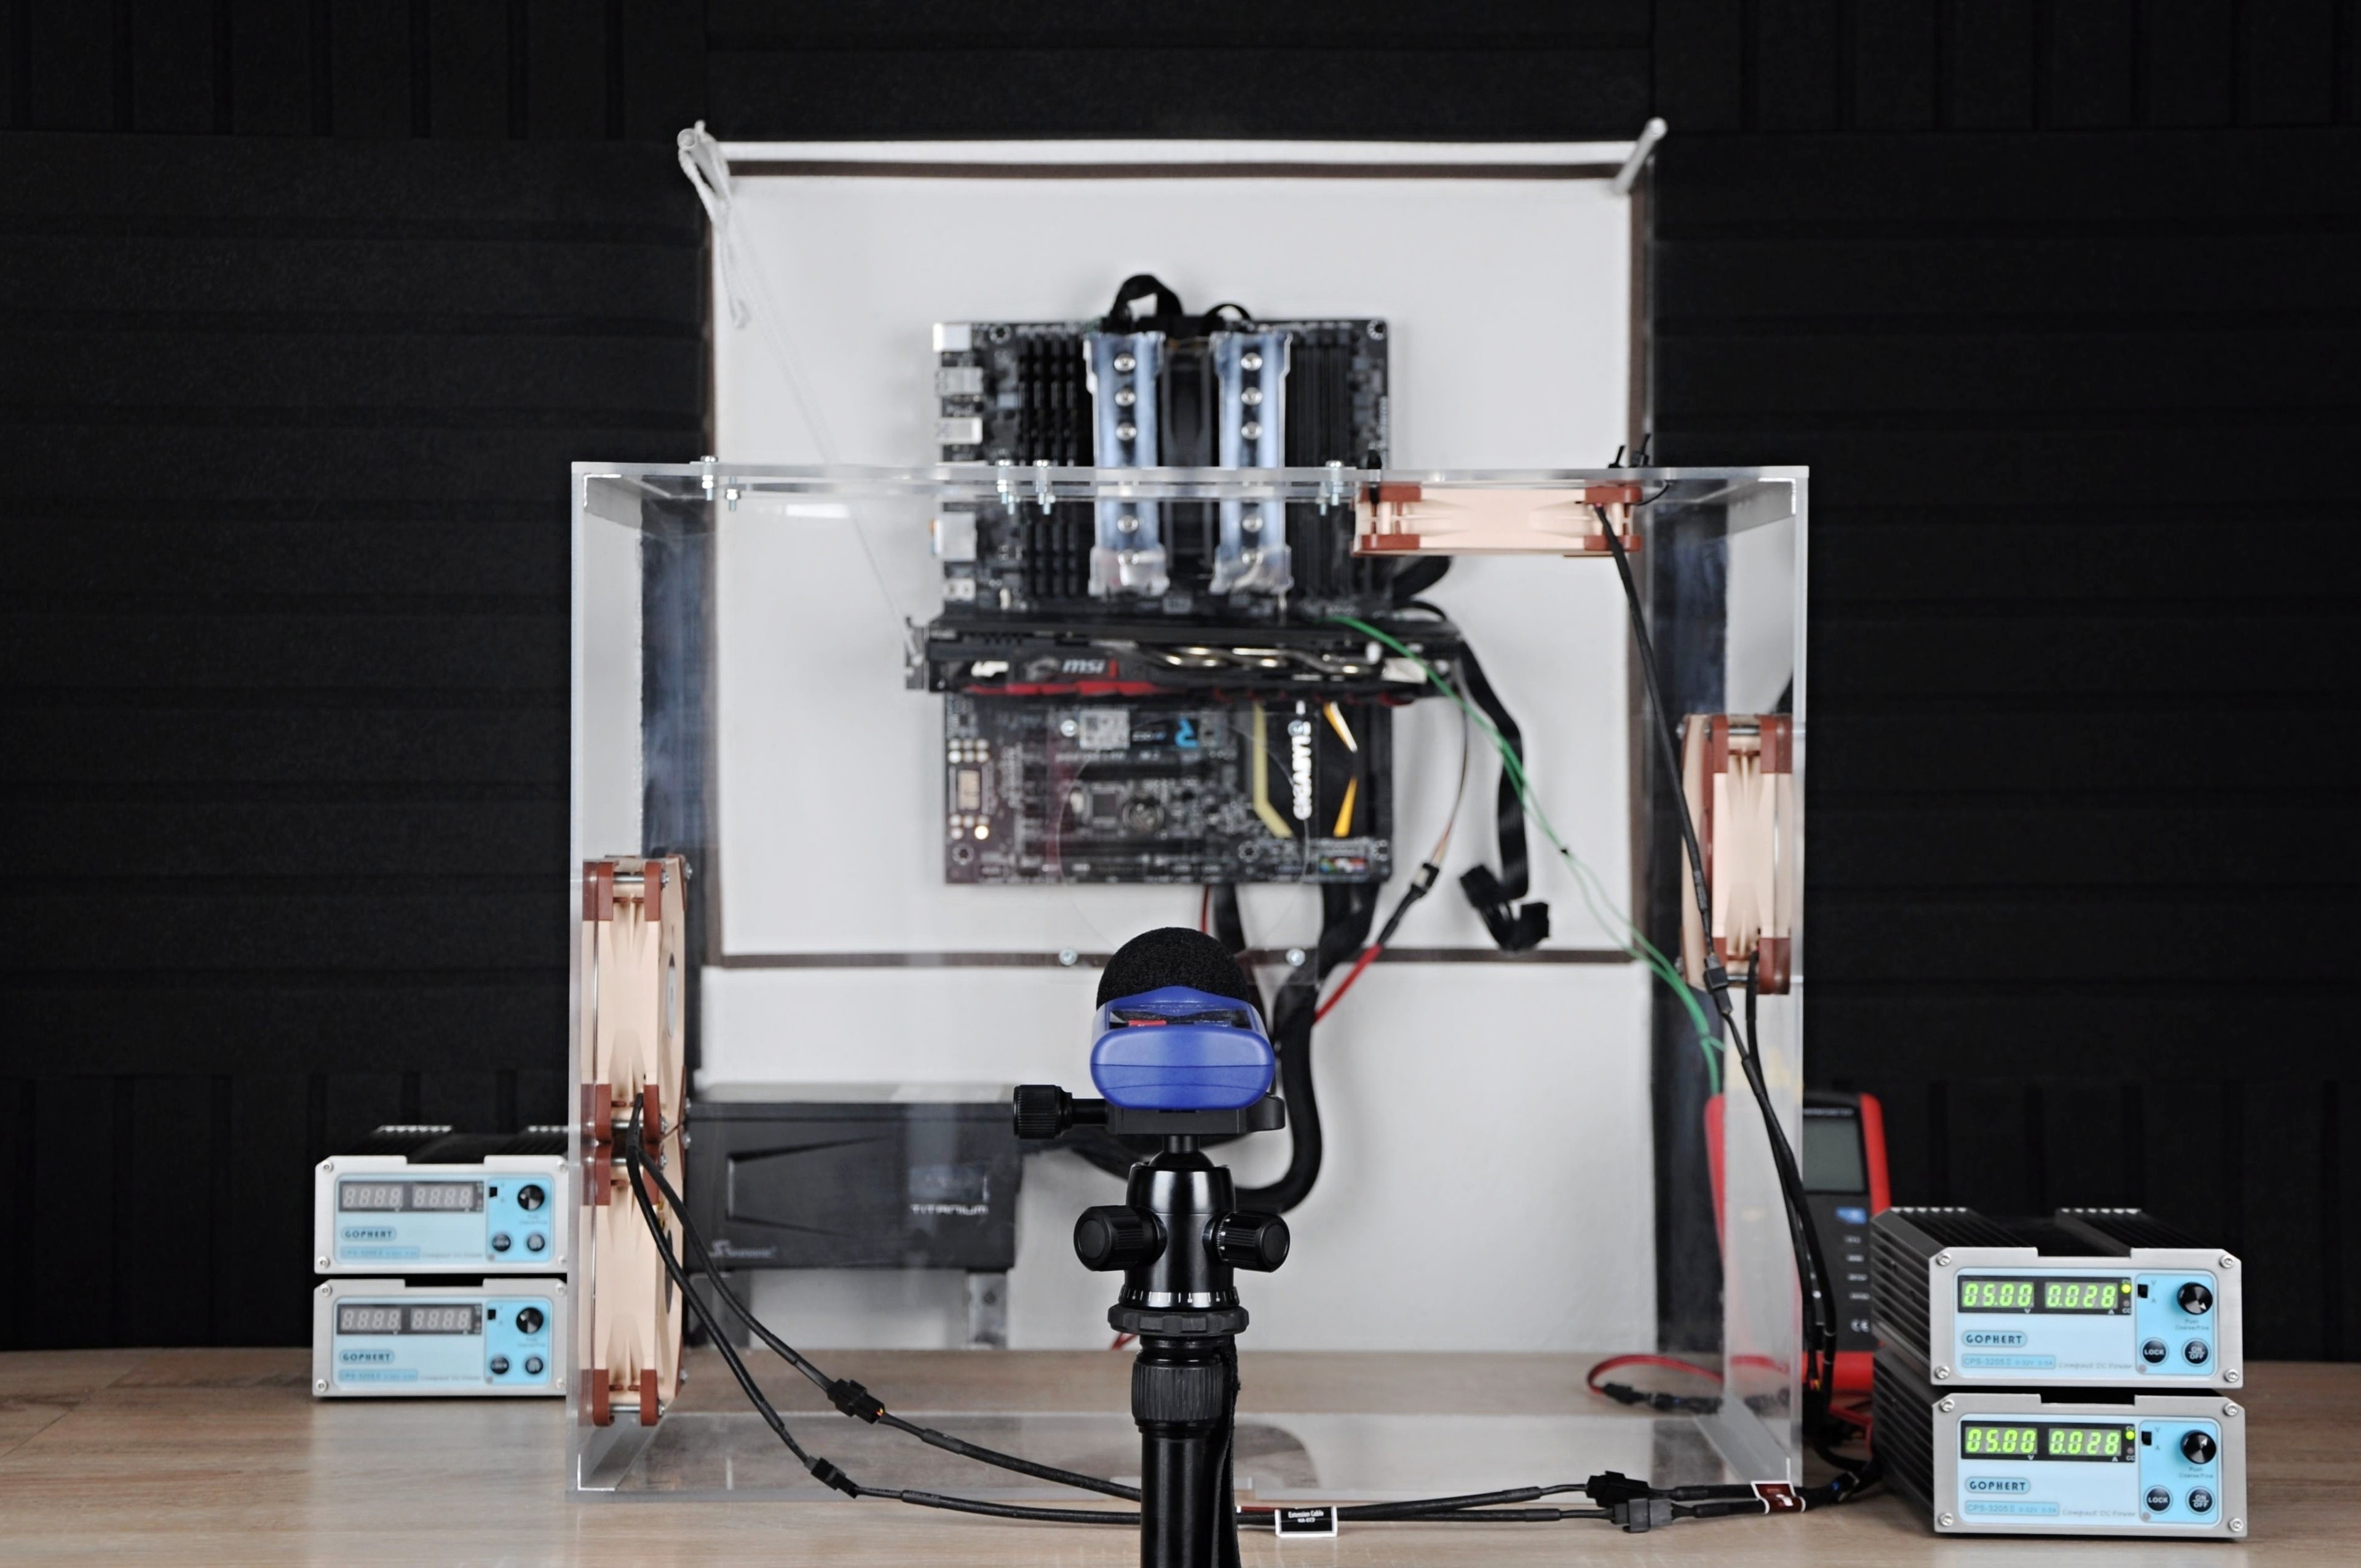
The air temperature at the entrance to the tunnel is properly monitored and is always at 21.0–21.1 °C during measurements. This very narrow range is chosen to ensure the highest possible accuracy of the measurements.
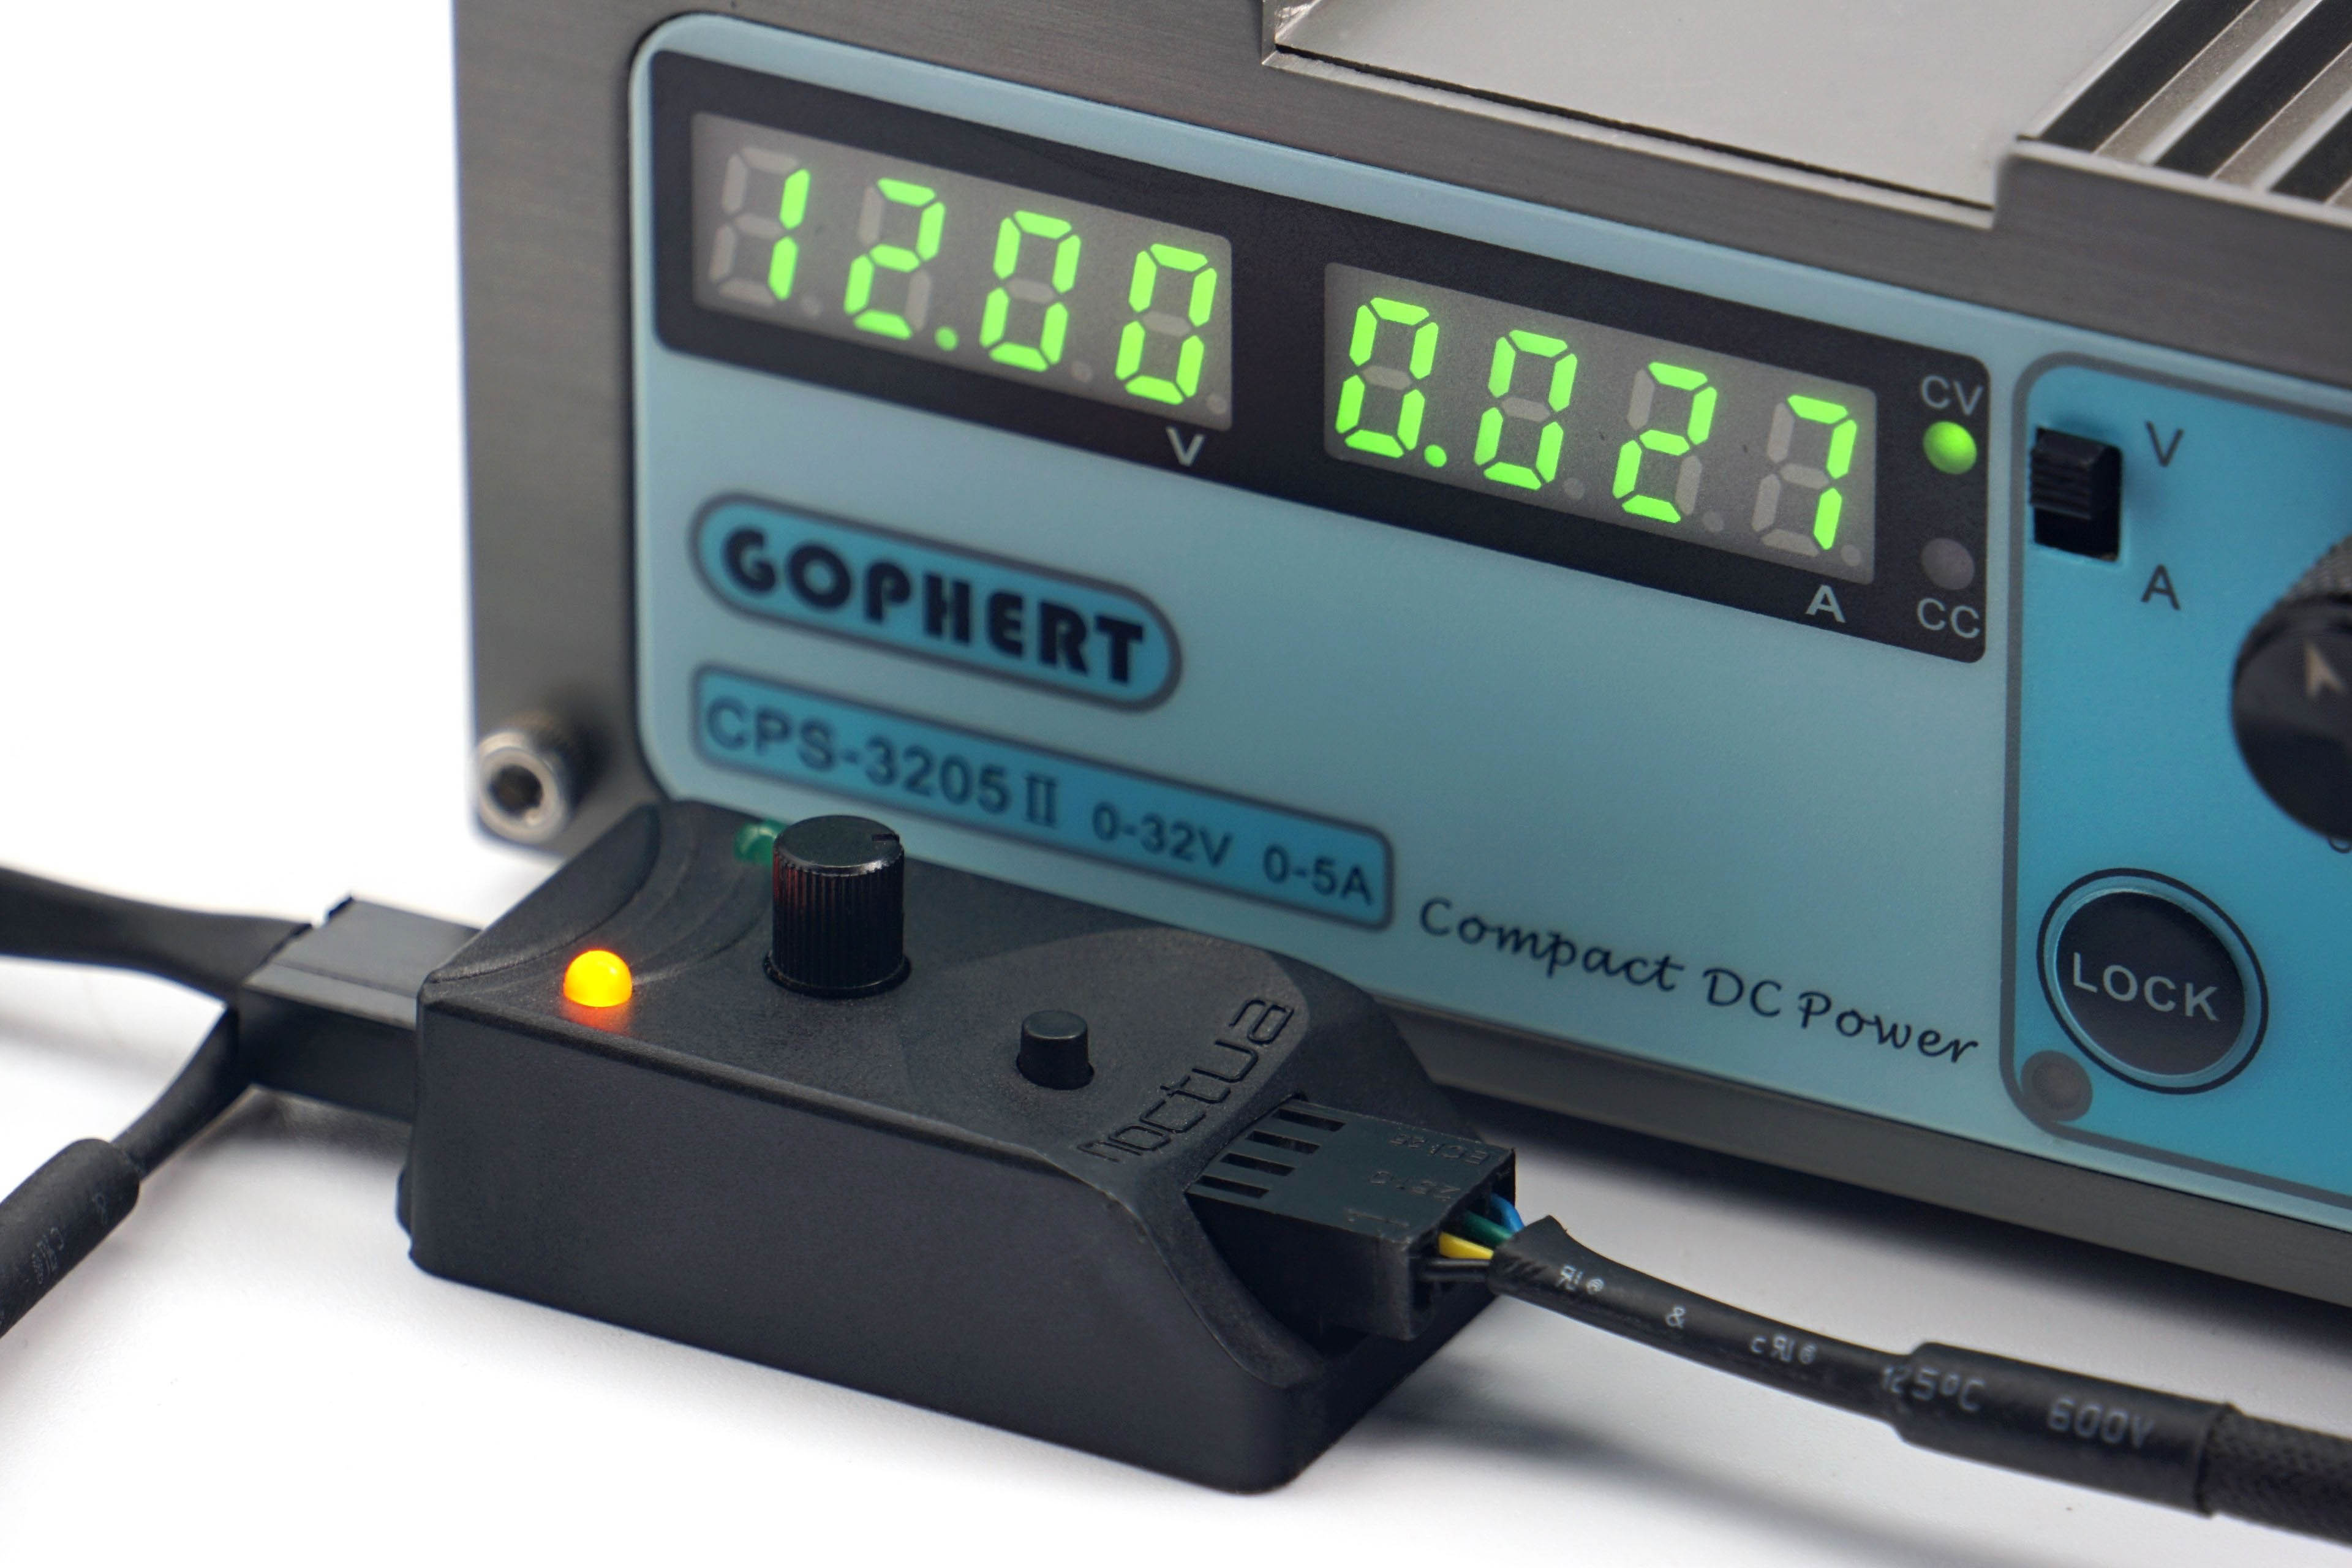
The coolers are tested at several noise levels. In addition to a maximum noise level, then at 45, 42, 39, 36, 33 and 31 dBA. So we progress from higher noise levels to very low noise levels. The individual modes are carefully controlled by a Gophert CPS-3205 II laboratory power supply, whose potentiometer is turned until the target noise level is reached on average (30 samples).
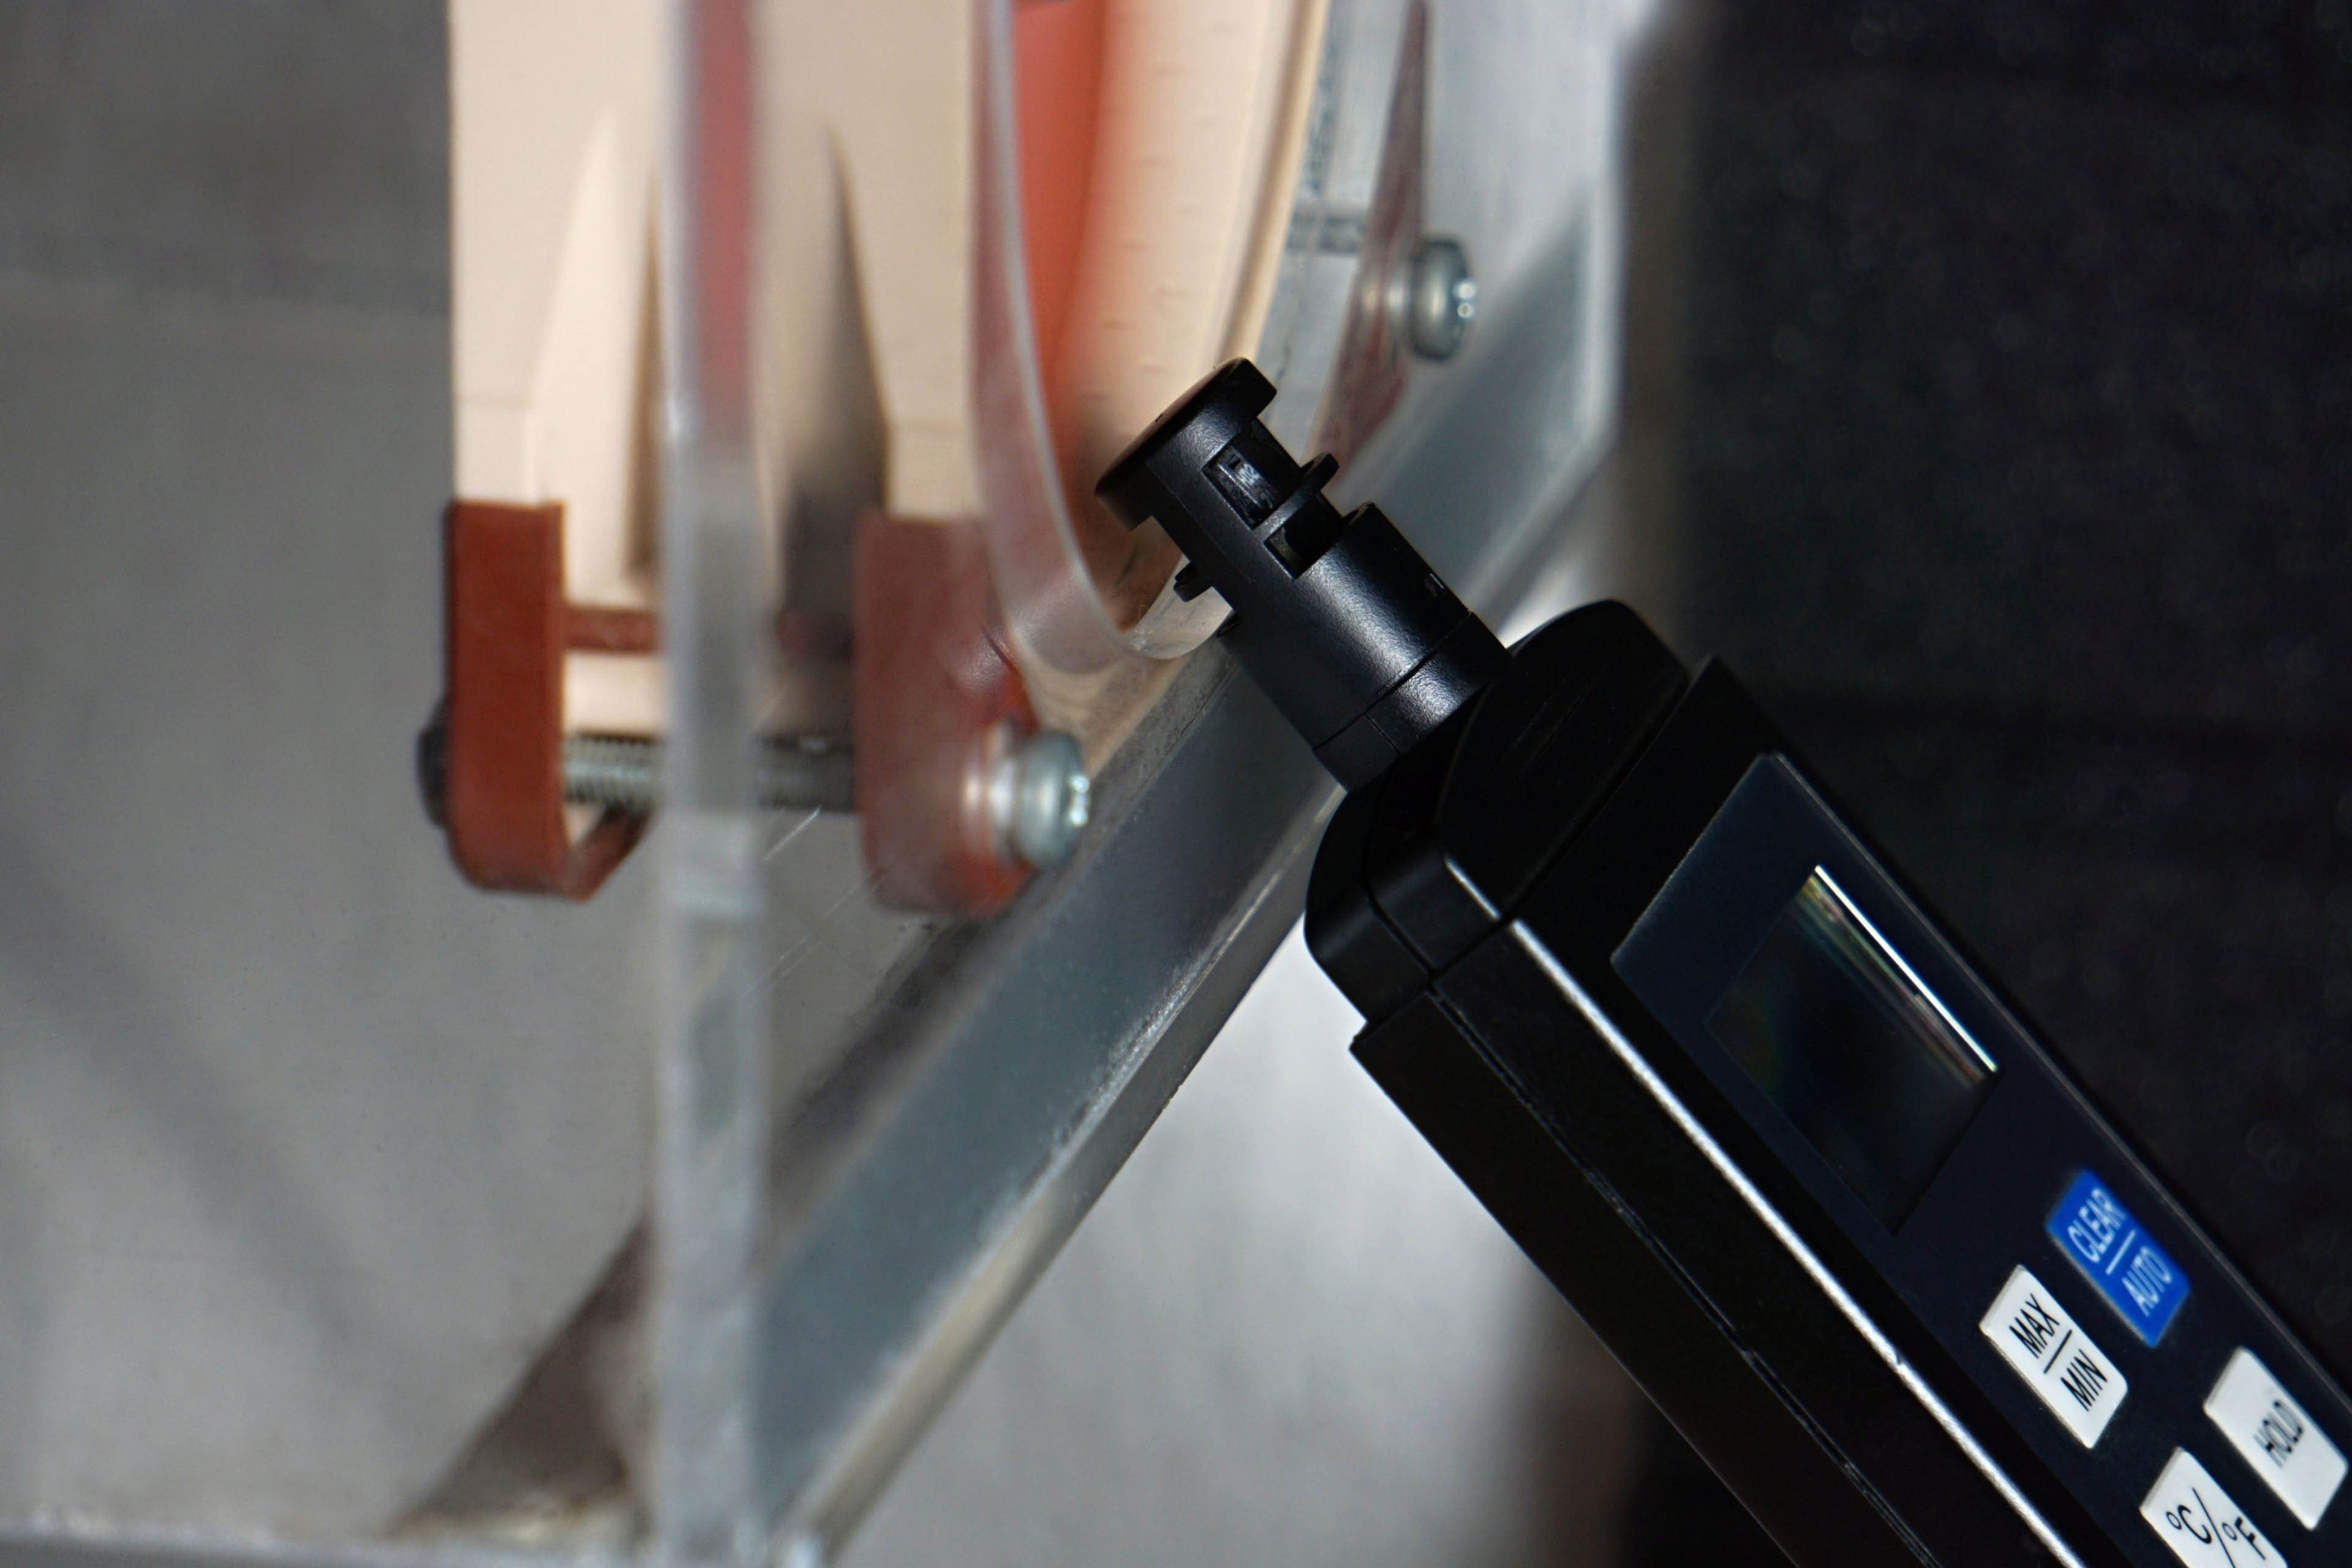
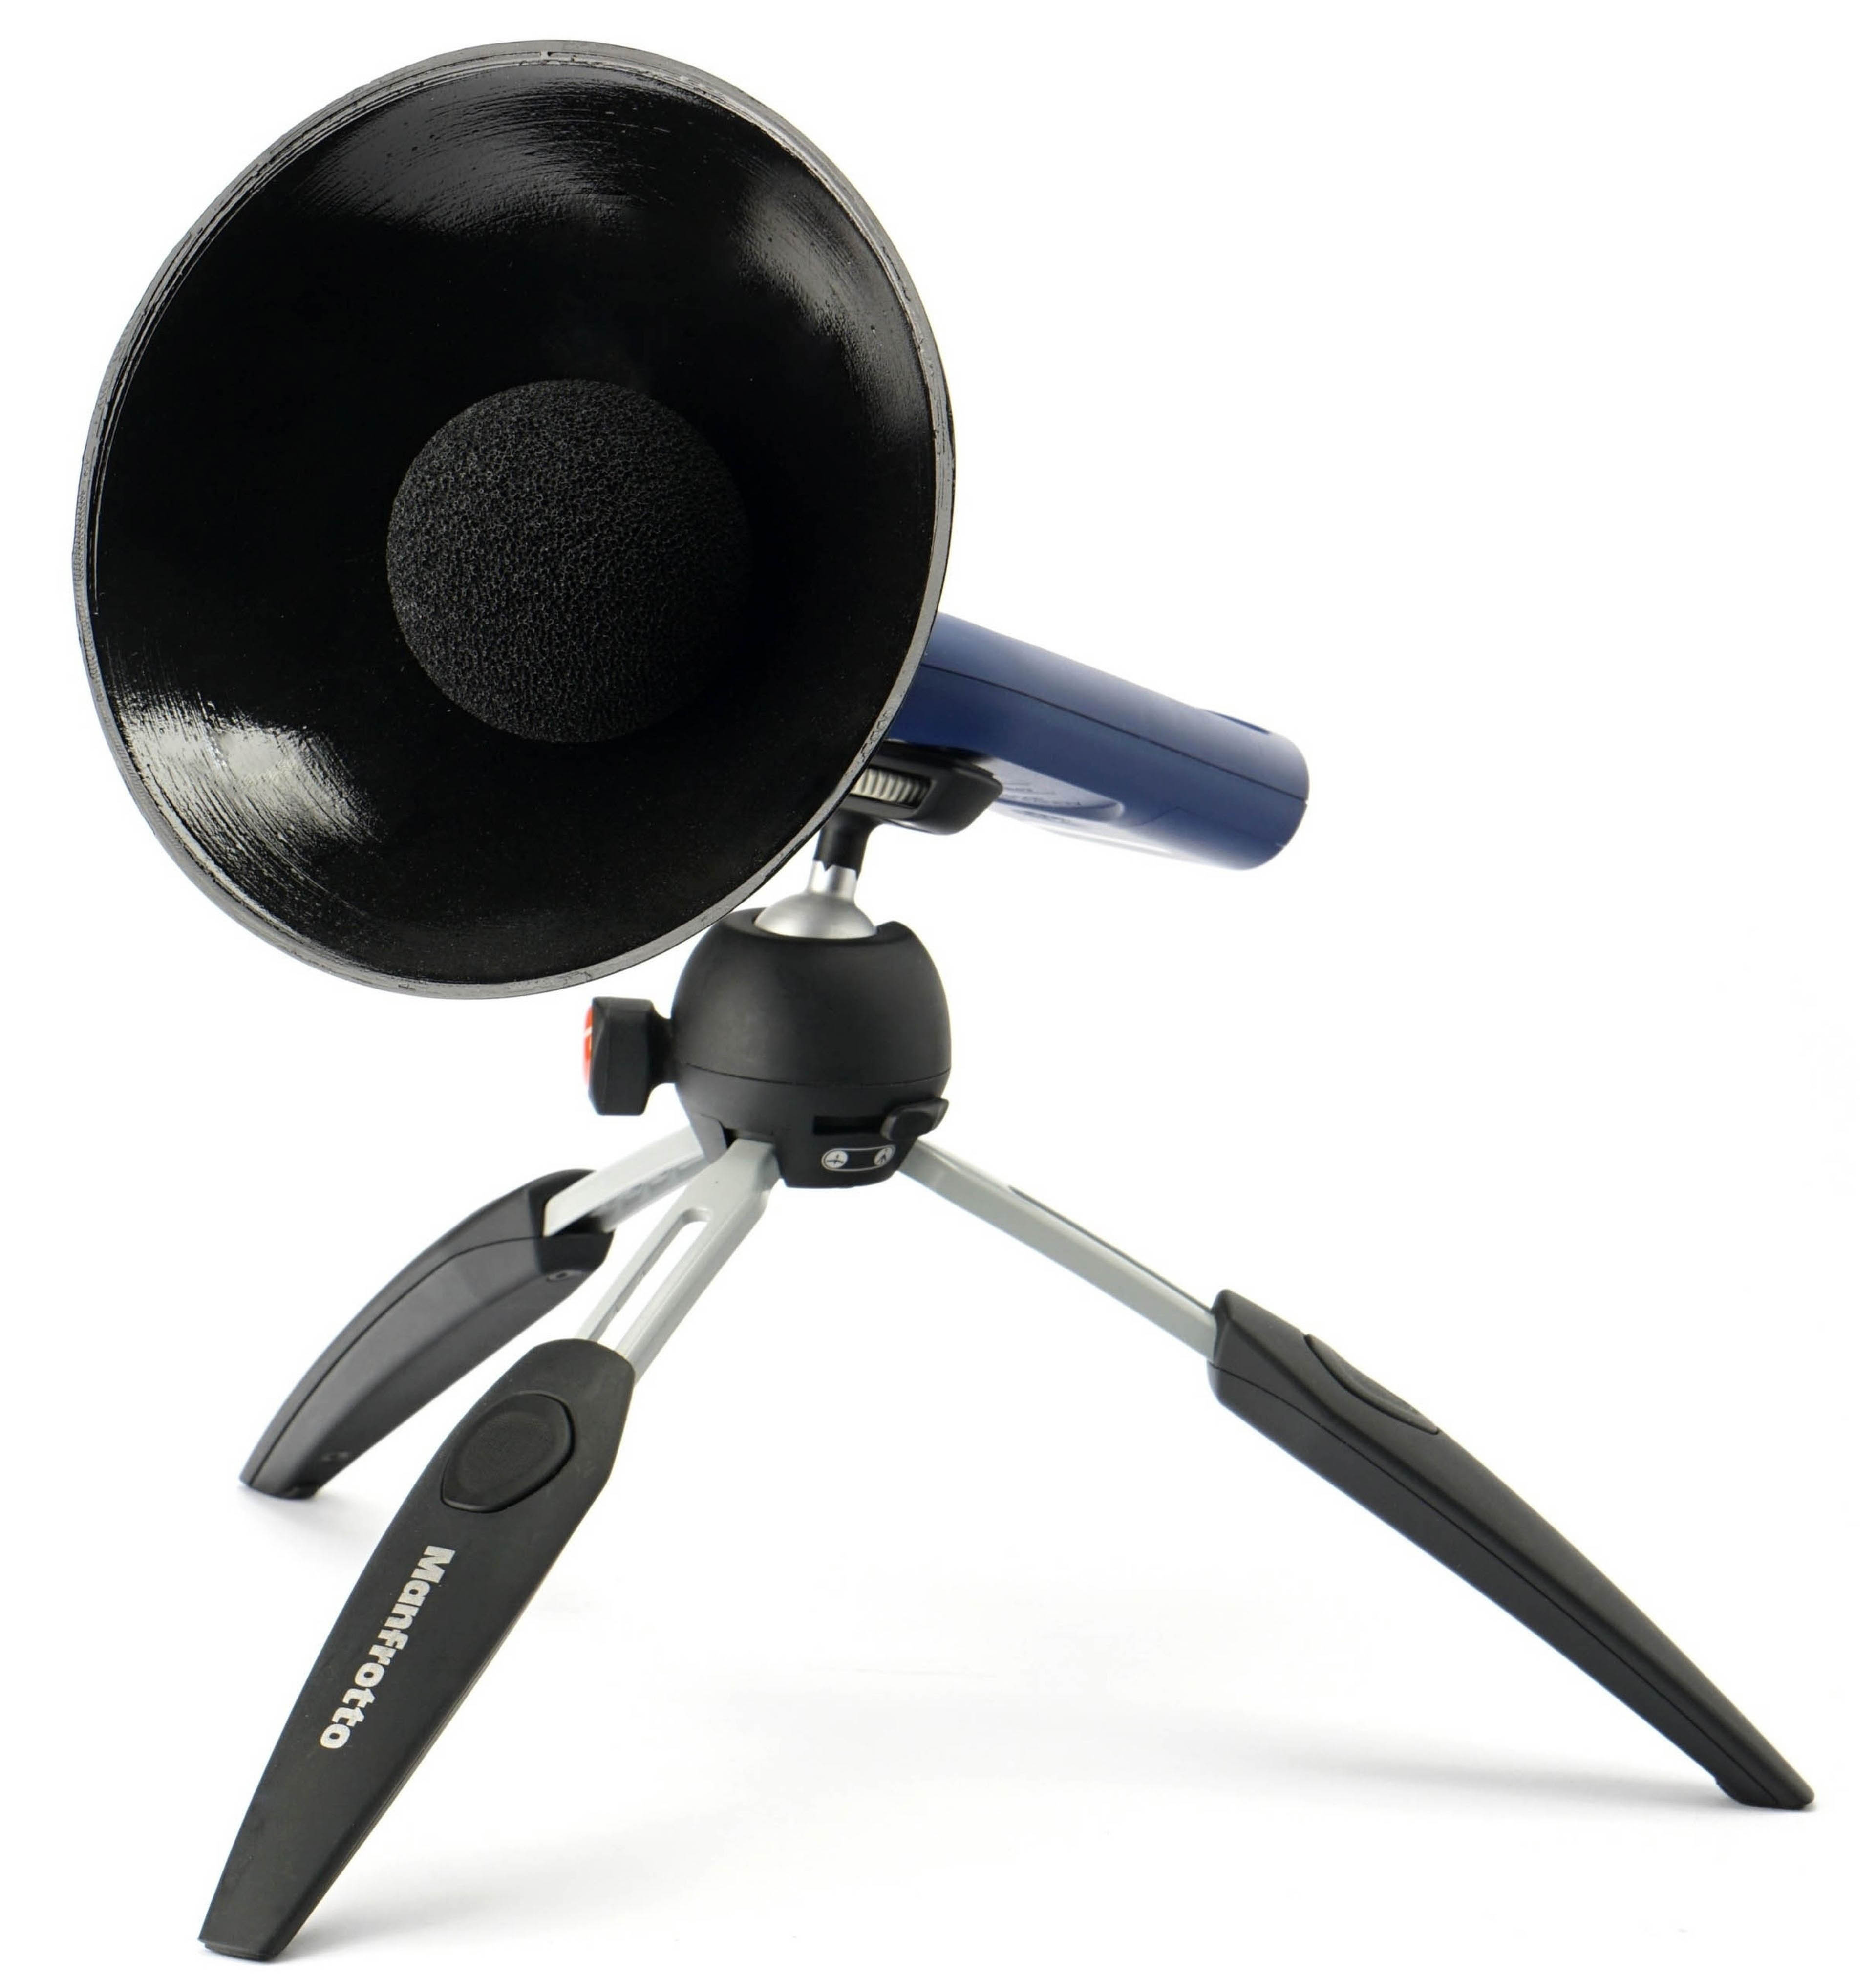
The relative distance between a cooler, which is the only source of noise for the purpose of normalising the settings, and the noise meter sensor is between 20–40 cm. With liquid coolers, the distance is greater. As long radiators extend more into the space, they are typically positioned higher in the case, or there is some distance between the pump and the fans on the radiator. The fan noise is always measured from the side, but from a relatively short distance, which blurs the differences between side and frontal sensing in terms of differences in noise due only to different sensing angles. If you’re interested in this topic, you can also read our editorial interview with a Noctua employee, who has a very strong technical background.

For the highest resolution possible, the Reed R8080 noise meter, which we use for the tests, has one addition – a parabolic collar. In addition to increasing sensitivity, this suppresses interfering noise that would enter the recording from the background. Unwanted sound reflections are eliminated by acoustic panels. Actually, this is the same test scheme as was used in our graphics card tests. The only thing different is the inclination of the noise meter, or microphone. The one (microphone) we use is the UMIK-1 miniDSP. But this is solely for the purpose of creating sound spectrograms illustrating the acoustic response of individual coolers. In this analysis, we proceed only after setting a specific cooler to a specific noise level with a noise meter.
Cooling performance evaluation of coolers is done on two platforms, Intel LGA 1851 and AMD AM5, on Intel Core Ultra 9 285K and AMD Ryzen 9 9950X processors.


The motherboards running the processors (MSI MEG Z890 Ace with BIOS v7E22v1A41 and Asus ROG Strix X870E-E Gaming WiFi with BIOS v0706) have significantly oversized VRMs. This is so that the VRM is never a bottleneck whose effect would be to reduce performance sooner than that of the cooler’s cooling performance. The latter is the guideline in cooler tests.

As you are used to, one of the monitored parameters is the temperature difference on the CPU cores. Motherboard BIOSes have their power supply limits removed. As such, the temperature limit is determined by the capabilities of the CPU cooler. However, lower temperatures do not automatically mean higher cooling performance. When evaluating, one must take into account at what power consumption they are achieved. If at a lower consumption, it may or may not mean a lower computing performance of the processor. For this reason, something that could be termed “coolable power consumption” is also an important parameter. If this increases towards quieter modes with lower noise levels and naturally with lower cooling performance, then that’s a good sign for the cooler because it can keep the processor performing well. Naturally at higher heat, and higher power consumption here means more waste heat that needs to be dissipated from the processor. Anyway, in case the recorded power consumption would be lower, the cooler already starts to be the limiting factor with its possibilities and the temperature values already become impossible to compare. Or, a lower temperature may not mean a better result, as the CPU performance is lower along with it. So there are more parameters to consider. One of them is the clock speed of the CPU cores – the average clock speed. This concept of testing methodology will be applicable to small, low-profile models with lower cooling performance in addition to high-performance coolers.
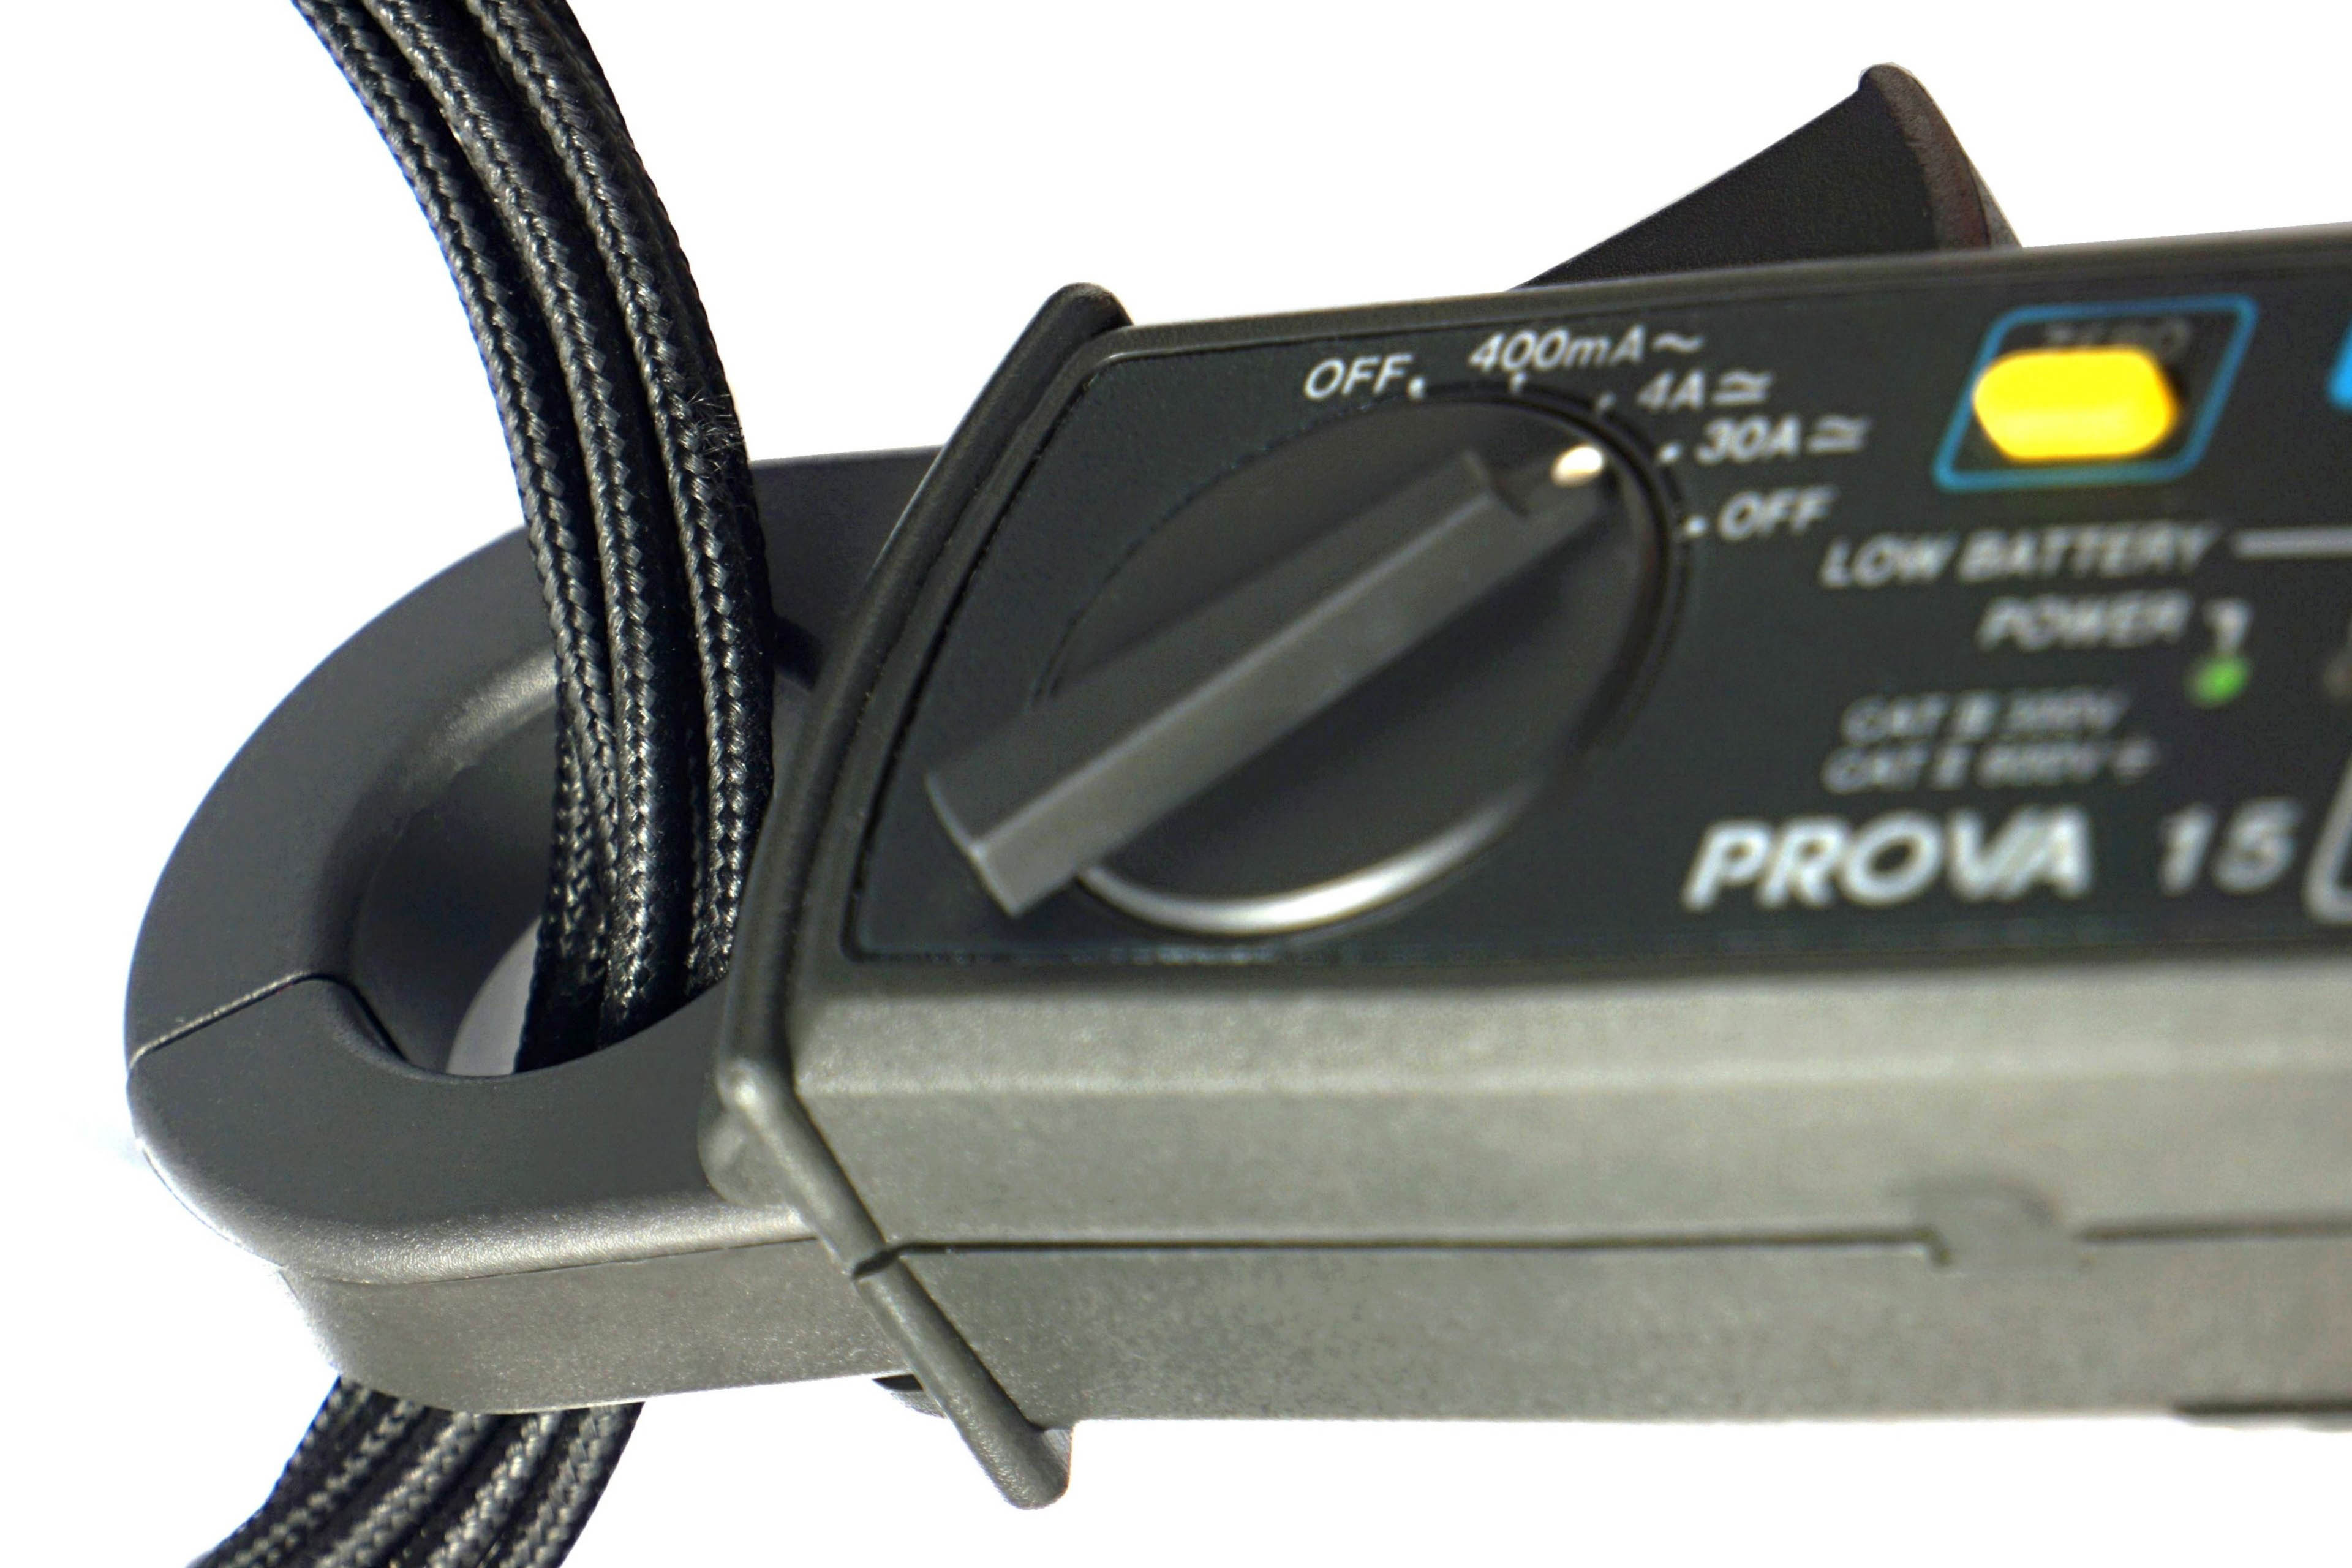
The electrical current, from which the power consumption is subsequently calculated, is recorded on the EPS cables with Prova 15 current clamps. The output is the average of the data from the last minute of the 600-second Cinebench R23 test. The temperatures (average of the maximum values of the individual cores) and the average clock speeds of the processor cores are obtained from a log in HWiNFO (v8.16-5600). How does this application work? Find out from our interview with its author.
Also important to get a complete picture are the VRM temperatures, which give you an idea of how well each cooler can cool critical components around the socket.
We use the thermal paste that comes with the coolers. Whether it is a pre-applied layer on the coldplate or we have to apply it from the tube. With traditional bases, the drop technique is applied to the middle of the processor IHS, on bases with DTH thin strips are applied to the shaped heatpipes. The amount of thermal paste is always approximately 0.066 ml. We chose to do this based on our knowledge from the thematic tests Spreading a thermal paste: how and how much? With coolers with pre-applied single-use thermal paste (no replacement thermal paste in accessories), we use the Thermal Hero Quantum thermal paste on the second test platform (which is always AMD AM5 and measurements on Ryzen 9 9950X).
For completeness: the test setup is powered by a BeQuiet! Dark Power Pro 12 (1200 W), the memory is G.Skill Trident Z5 Neo (2×16 GB, 6000 MHz/CL30) and finally, the SSD is a Patriot Viper VP4100 (1 TB).


“If you don’t care too much about noise … can also be paired … with Ryzen 9 or Core Ultra 9.”
I agree with the conclusion on the Intel side, but not on the AMD side. The difference in clocks of 9950X @ 31 dBA mode (4594) vs. max fan speed mode (4638) is only 44 mHz. You can run it extremely quietly while maintaining 99% performance. The difference between running it at 31 dBA vs the best tested 360 mm AIO cooler @ max speed (4707) is only 2.5%! It seems that the performance of Zen 5 (or at least the 9950X) is quite insensitive to cooling requirements. Perhaps it’ll show more performance decreases when low profile coolers start being tested.
“Although especially in the latter case, it will be advisable to set the power limits so that the performance of the processors does not decrease due to “overheating”.
In fact, I advice not setting power limits if you are after best performance. By artificially setting power limits to avoid hitting thermal limits, the CPU will throttle due to power even if it has thermal headroom to boost further.
You’re right, it’s good to discuss this and different perspectives on the same things are definitely welcome. 🙂
The Freezer 36 is not really suitable for the most powerful processors. But all this is meant in the context that the cooler is at the limit at which there is no dramatic drop in performance due to the available cooling power. Even in 31 dBA mode, the difference from the Fera 5 is bigger, and the Freezer 36 is the cooler that still handles this situation relatively well. Sure, the performance of the R9 9950X is lower with it too, but it is still clearly higher than with the Fera 5. Cooling Ryzen 9000s with the highest possible performance in mind will not be as difficult as with the Intel platform anyway.