

Image properties
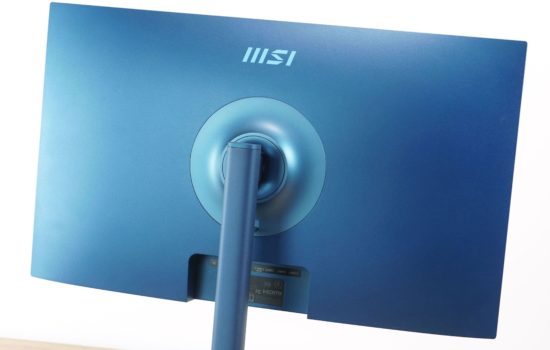
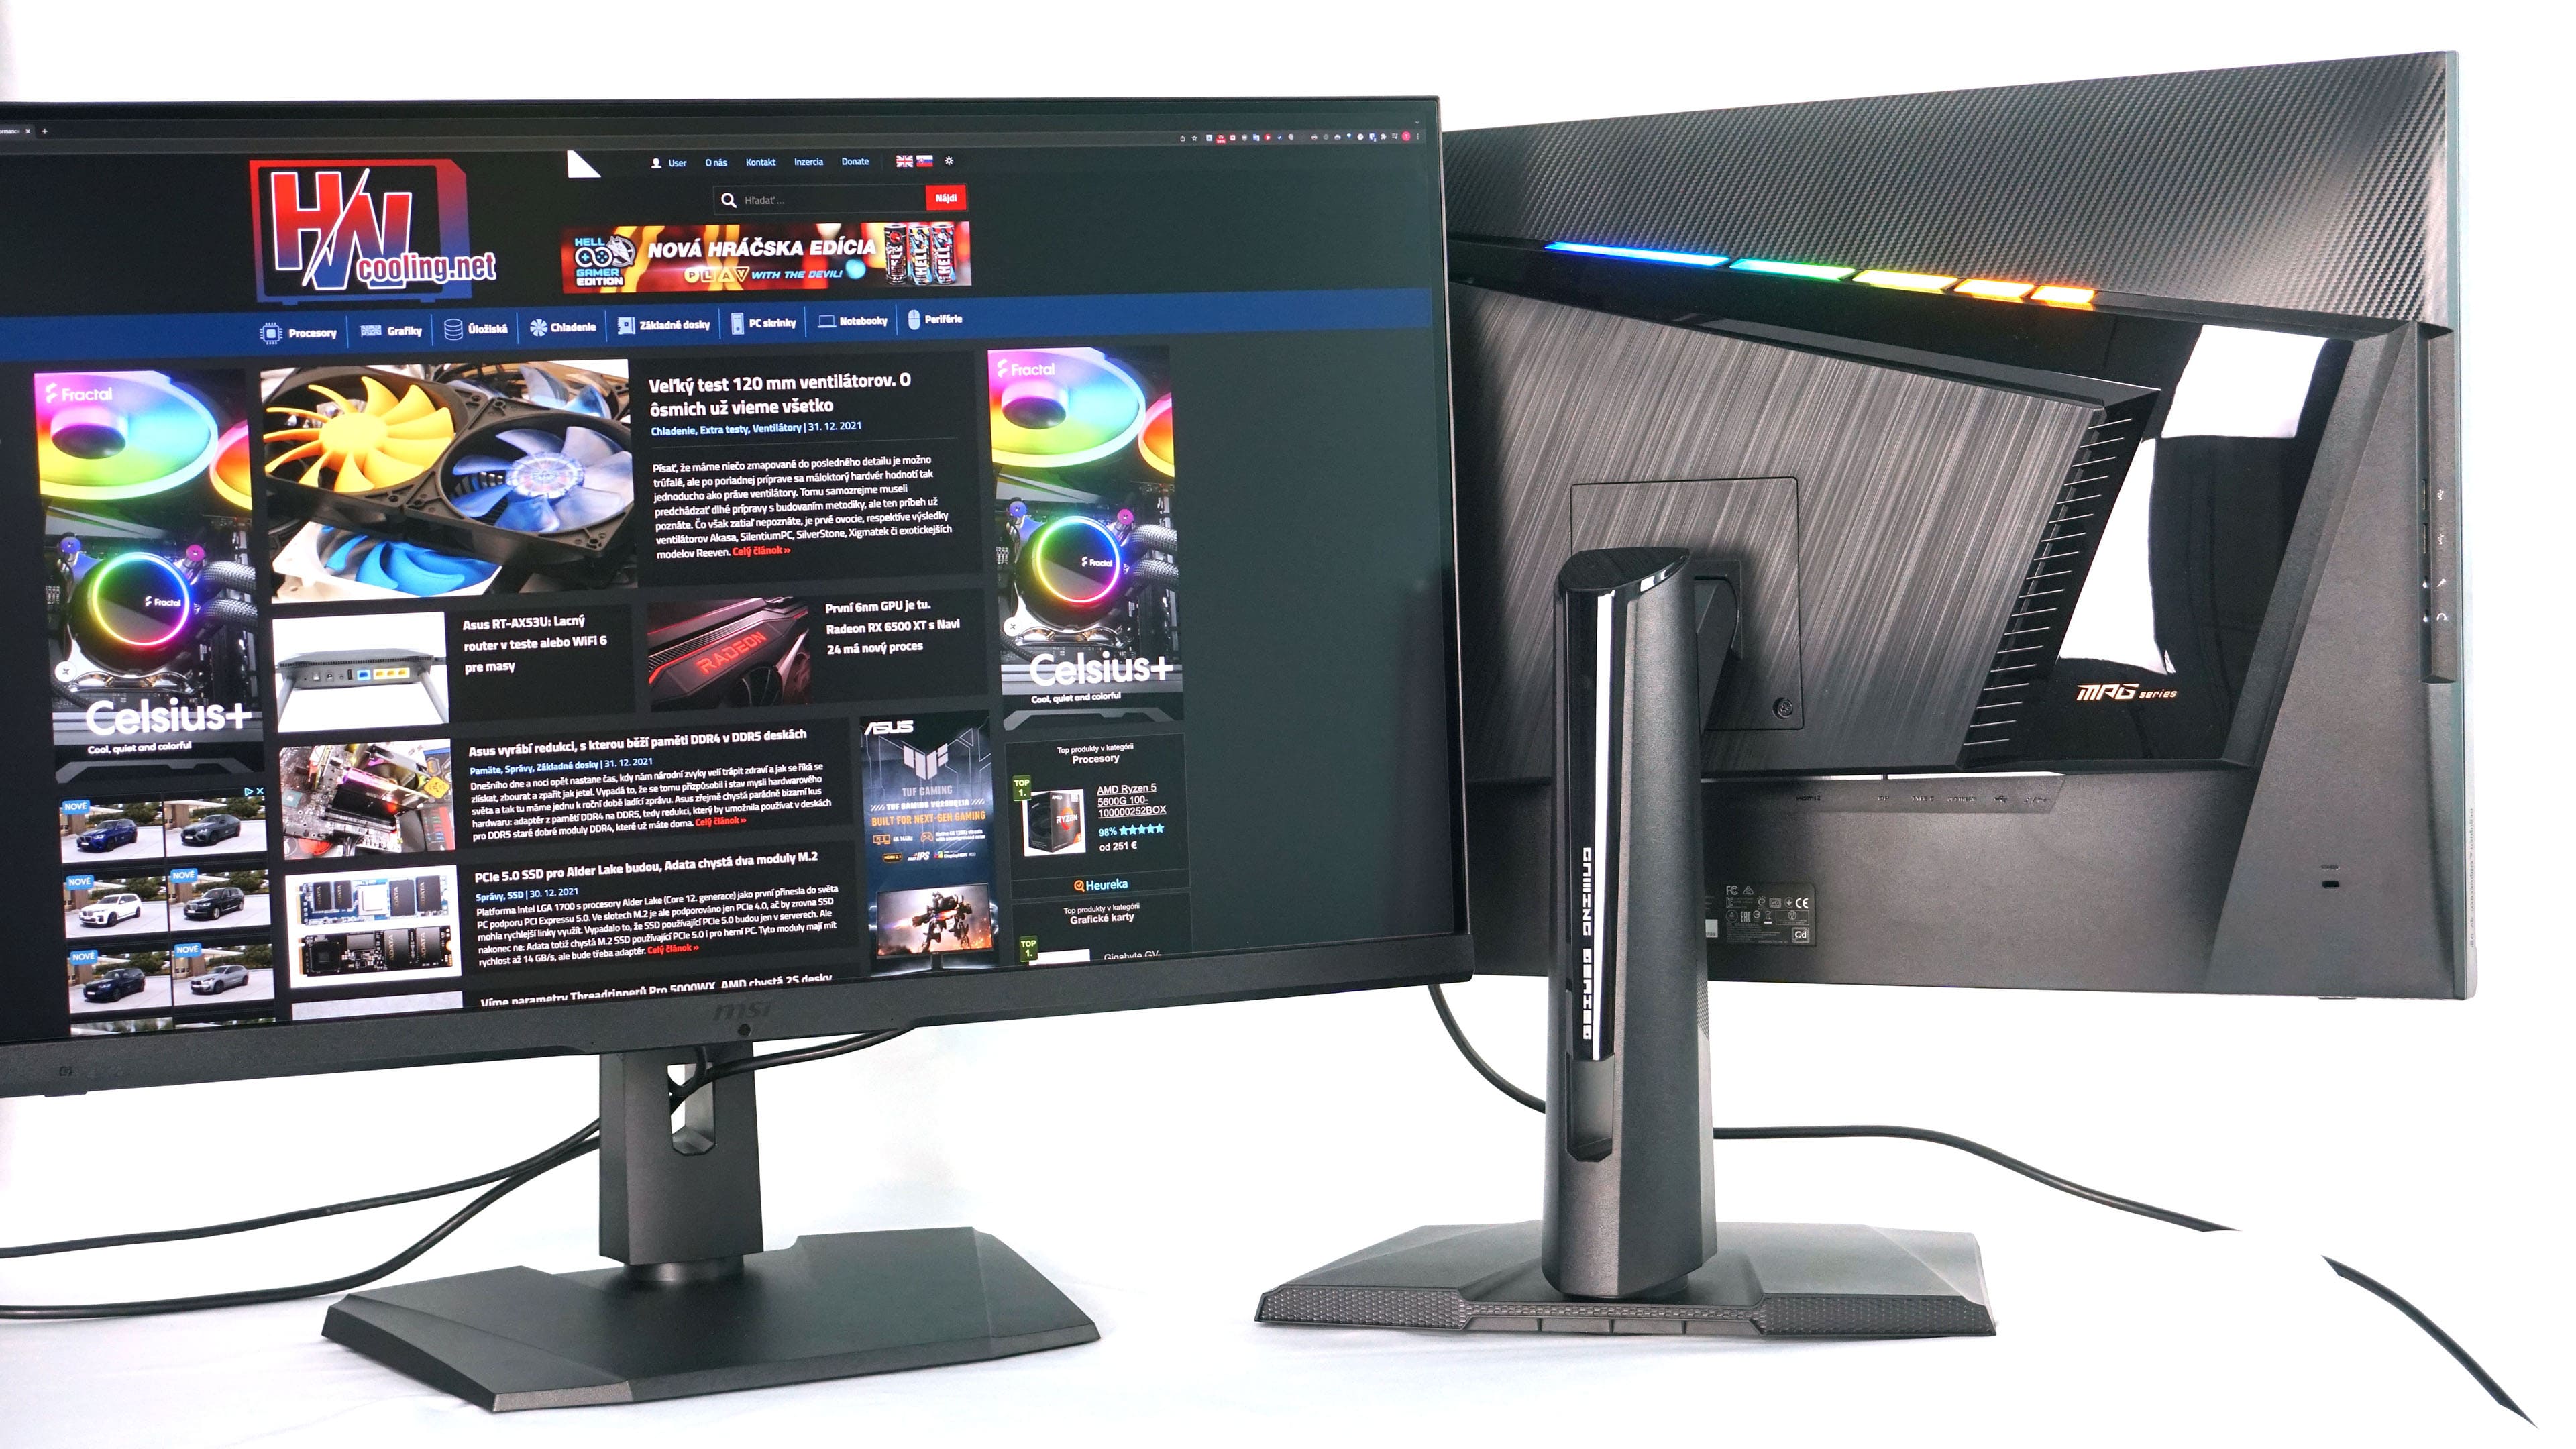
Until recently, 32-inch monitors were a relatively marginal category and manufacturers were pushing mainly the smaller 27″ versions. Recently, it seems as if the market is swarming with 32″ monitors, and after the latest from AOC, we take a look at two new gaming models from MSI right away. At first glance they look the same, but besides the name they differ in panels, connectivity, or other small details, which we will gradually break down.
Image properties
We tested the display properties using the Datacolor Spyder5Elite probe. The display in both cases has a 32″ IPS panel with a traditional 16:9 aspect ratio, the resolution corresponds to our internal naming, so UHD is 3840 × 2160 px and QHD is 2560 × 1440 px. There’s an anti-glare finish and even bezels on three sides. The brightness parameters are also identical, which the manufacturer puts at 400 nits in normal operation with HDR peaking at 600 nits, 1000:1 contrast ratio and that’s more or less where the similarity ends. It’s worth noting that both displays are G-Sync Compatible certified, which has also been detected accordingly by the Nvidia Control panel. Both monitors have support for gaming consoles, but only the UHD model got the newer HDMI 2.1, while the QHD relies on HDMI 2.0b.
So let’s move on to the differences. The UHD model has a lower frame rate of 144Hz, which is top of the range for UHD resolution. The QHD model, however, has 165 Hz as standard and can reach up to 175 Hz after overclocking. We’ve seen faster QHD panels before, but not in this size. Also different is the response time, the UHD model having 1 ms in MPRT mode and the QHD model having the same value in GTG. The UHD version has a slightly higher quality panel as it natively supports 10 bit depth, while the QHD relies on 8 bit + FRC. The difference in the panel is also reflected in the gamuts presented, where the UHD model is said to offer 99 % Adobe RGB, 97 % DCI-P3 and 143 % sRGB.The QHD version has a slightly lower 95 % DCI-P3 and a slightly higher 144 % sRGB.
We start our display quality tests with the UHD model.
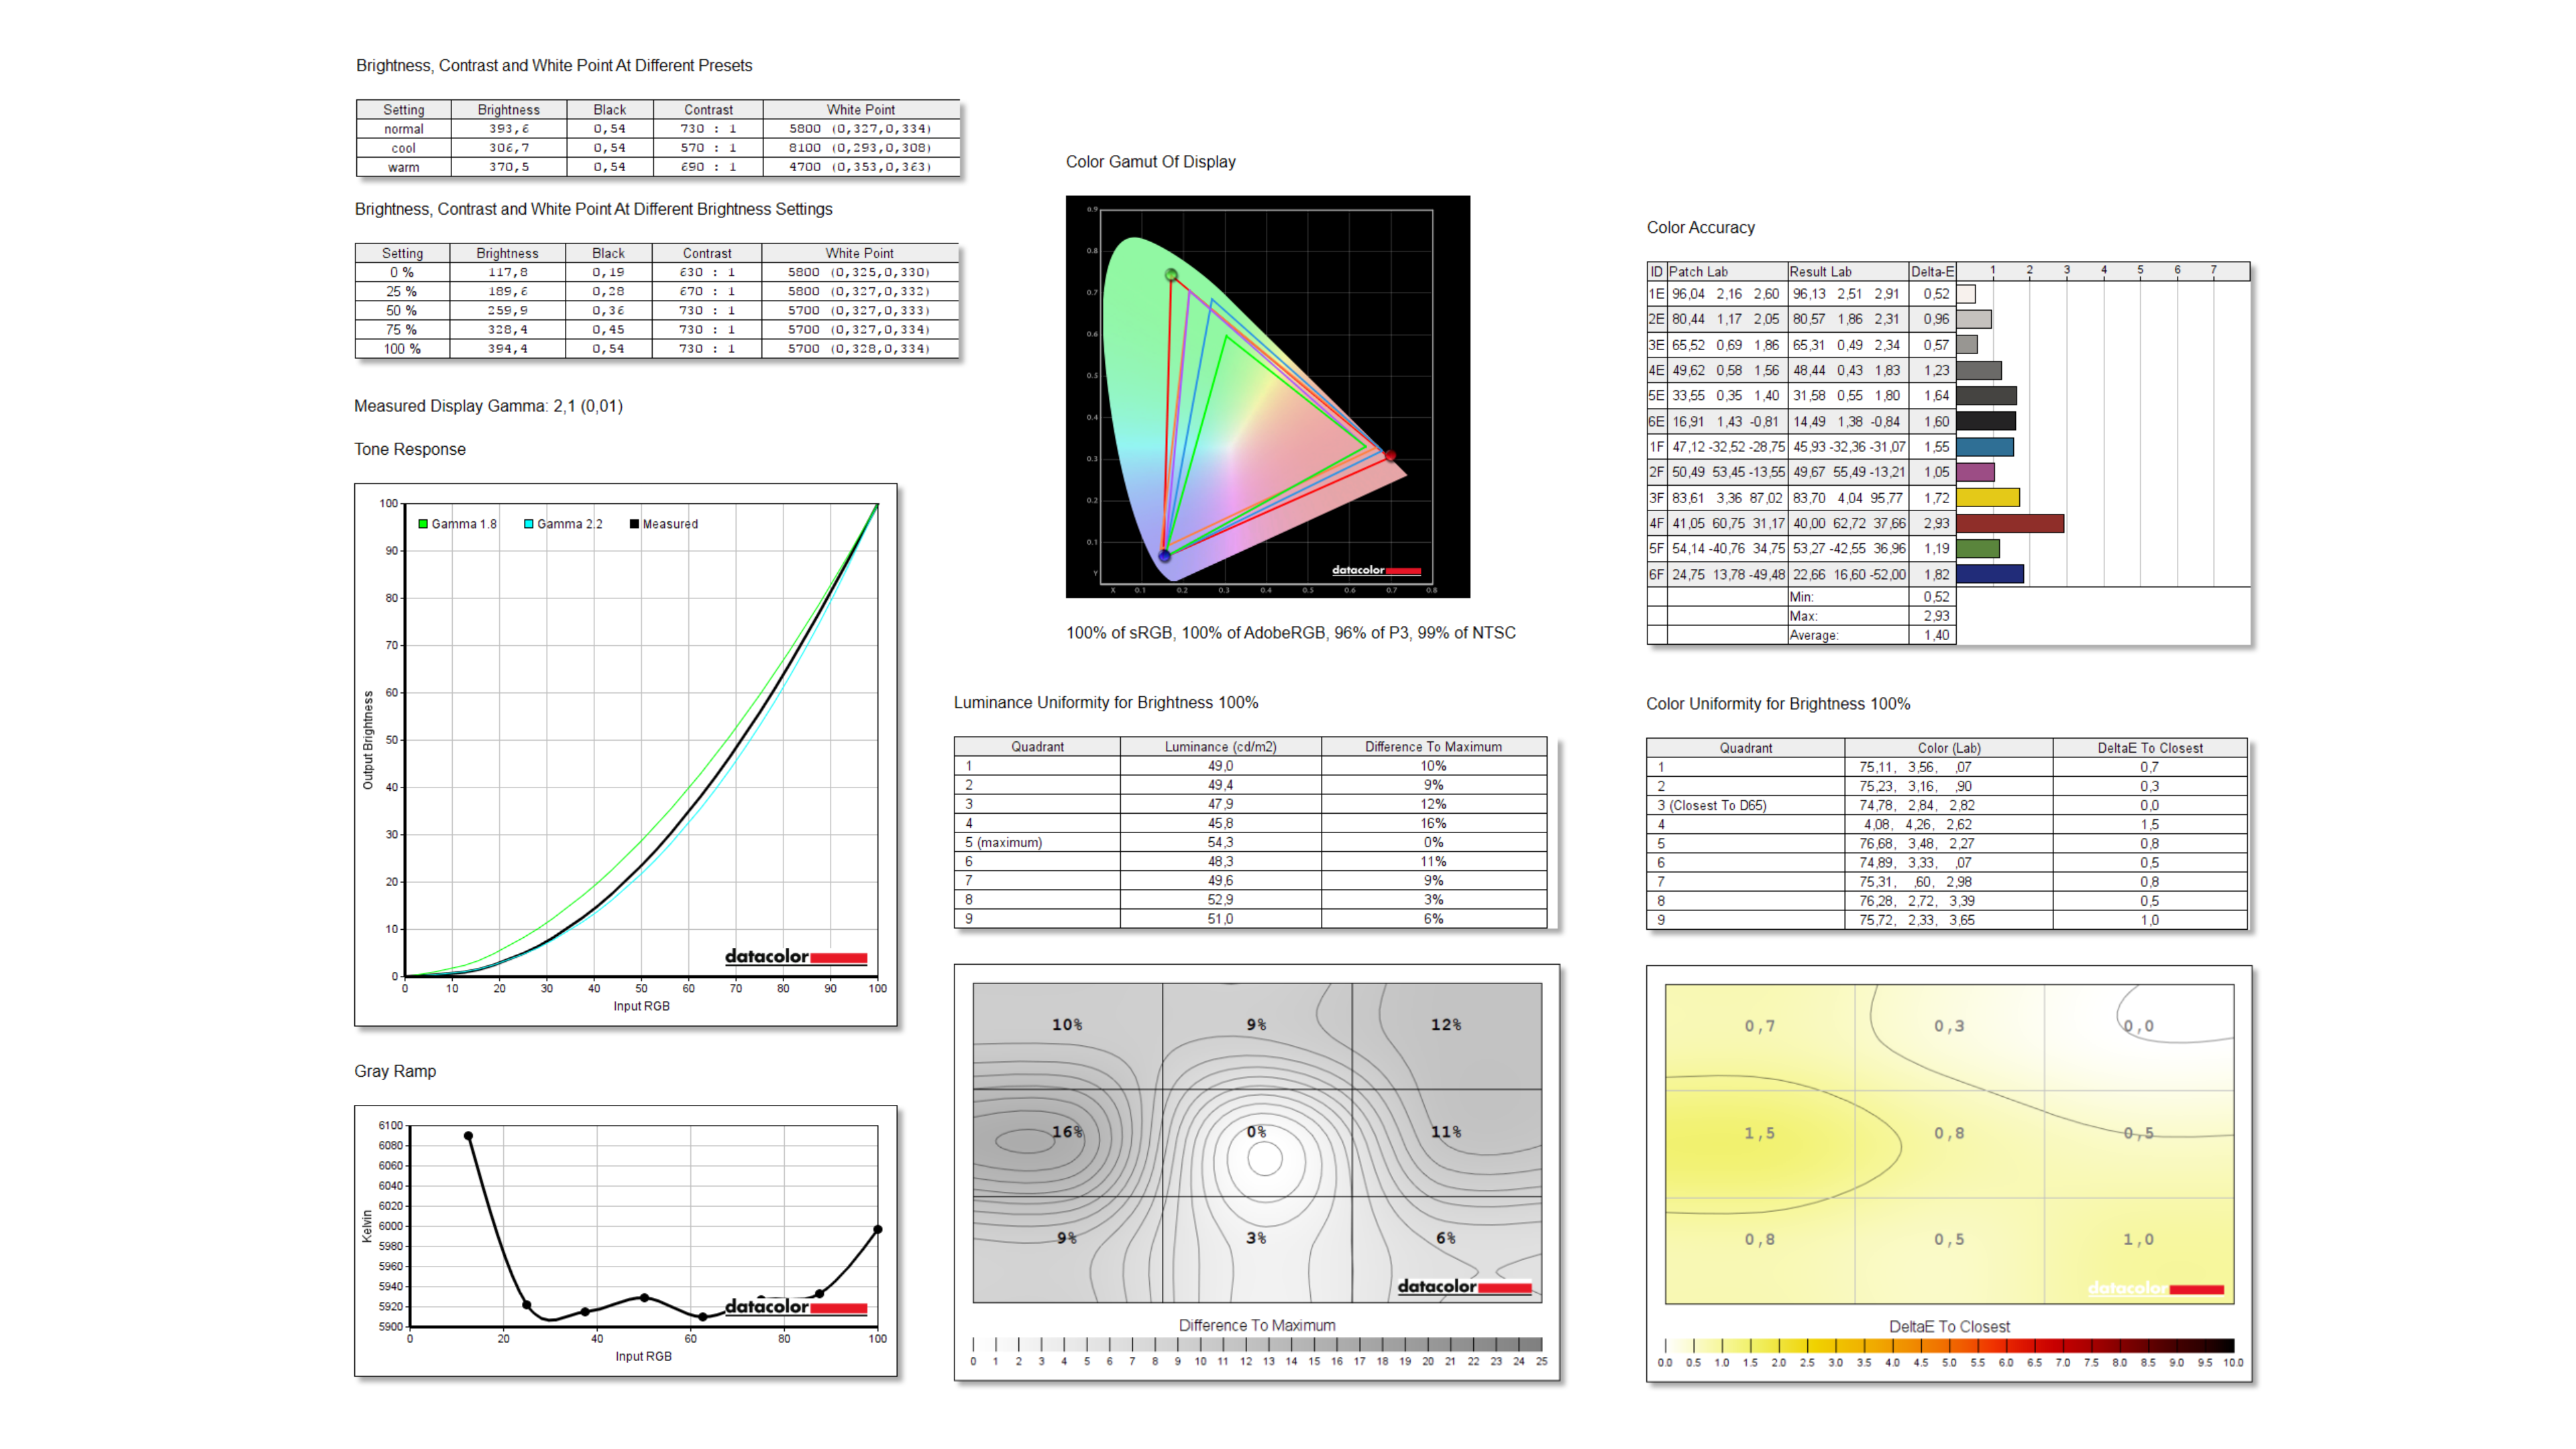
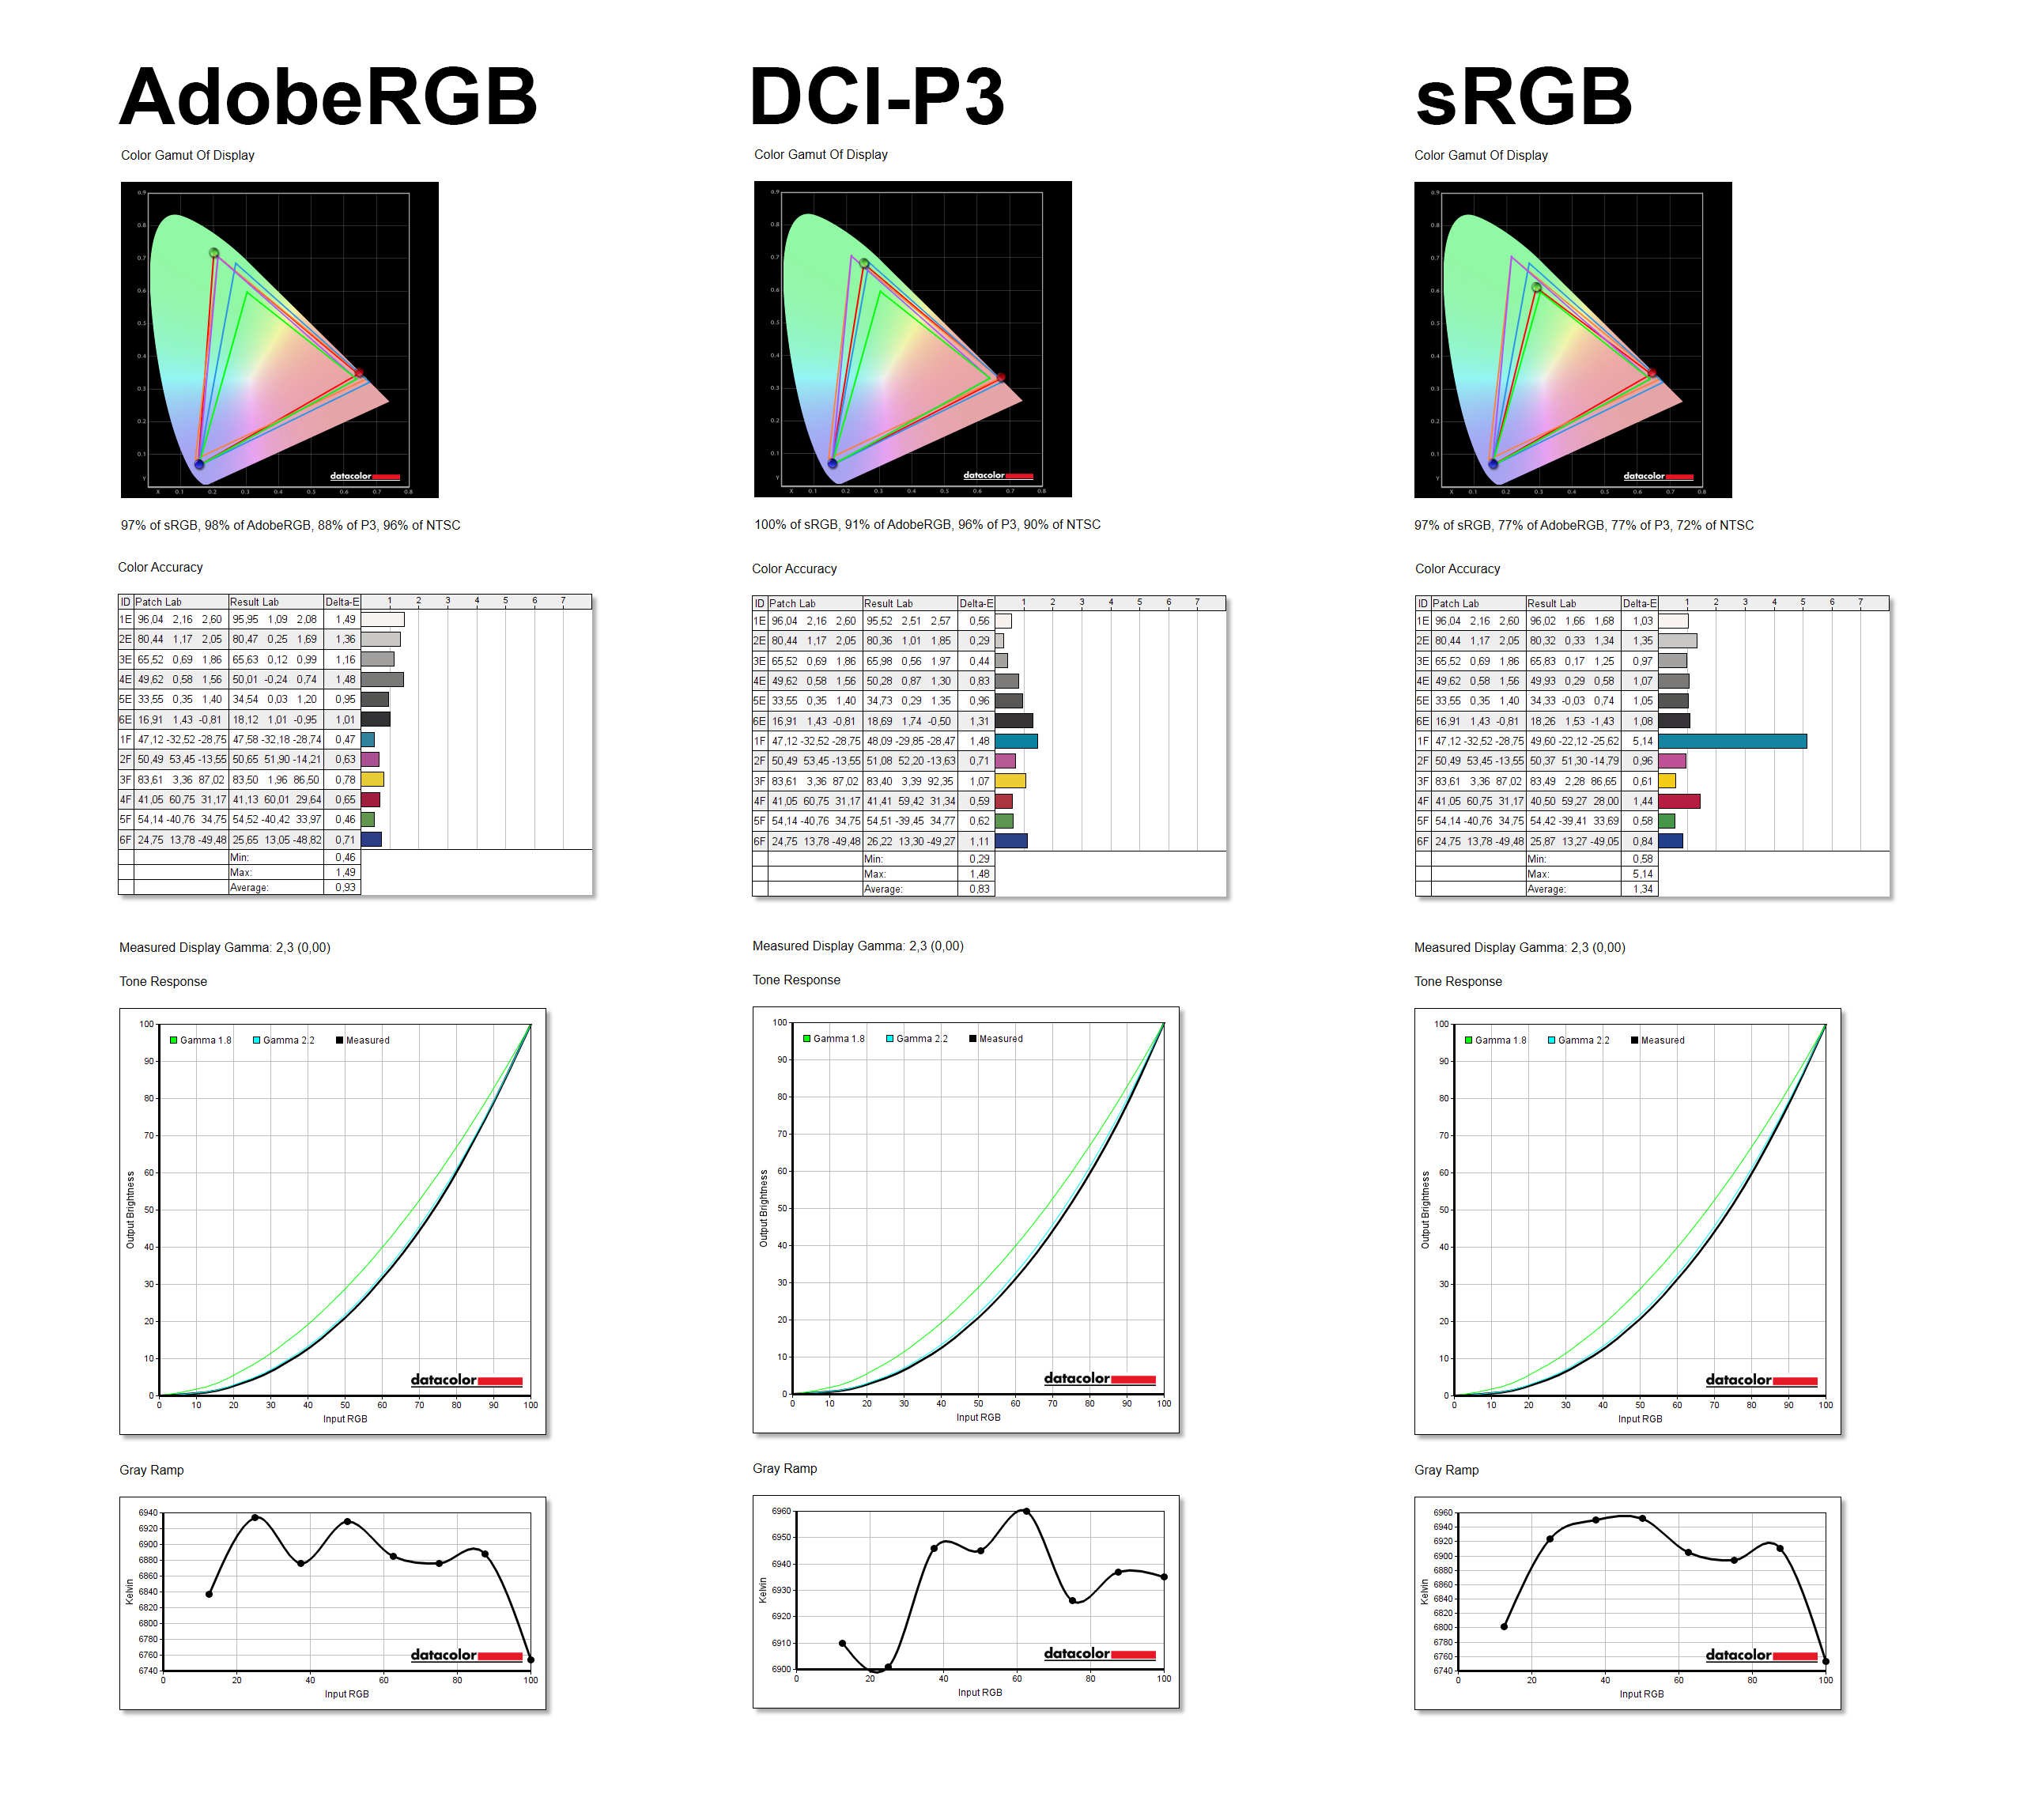
It did very well in basic settings. It achieved the expected brightness of 394.4 nits, had great values of 100 % sRGB, 100 % Adobe RGB, 96 % DCI-P3 and 99 % NTSC as well as a very good average Delta E colour deviation of 1.4. These are some of the best measured results we’ve ever had, which is all the more surprising given that it’s a gaming model. The uniformity is also very good, which only confirms our assumptions from the black level test.
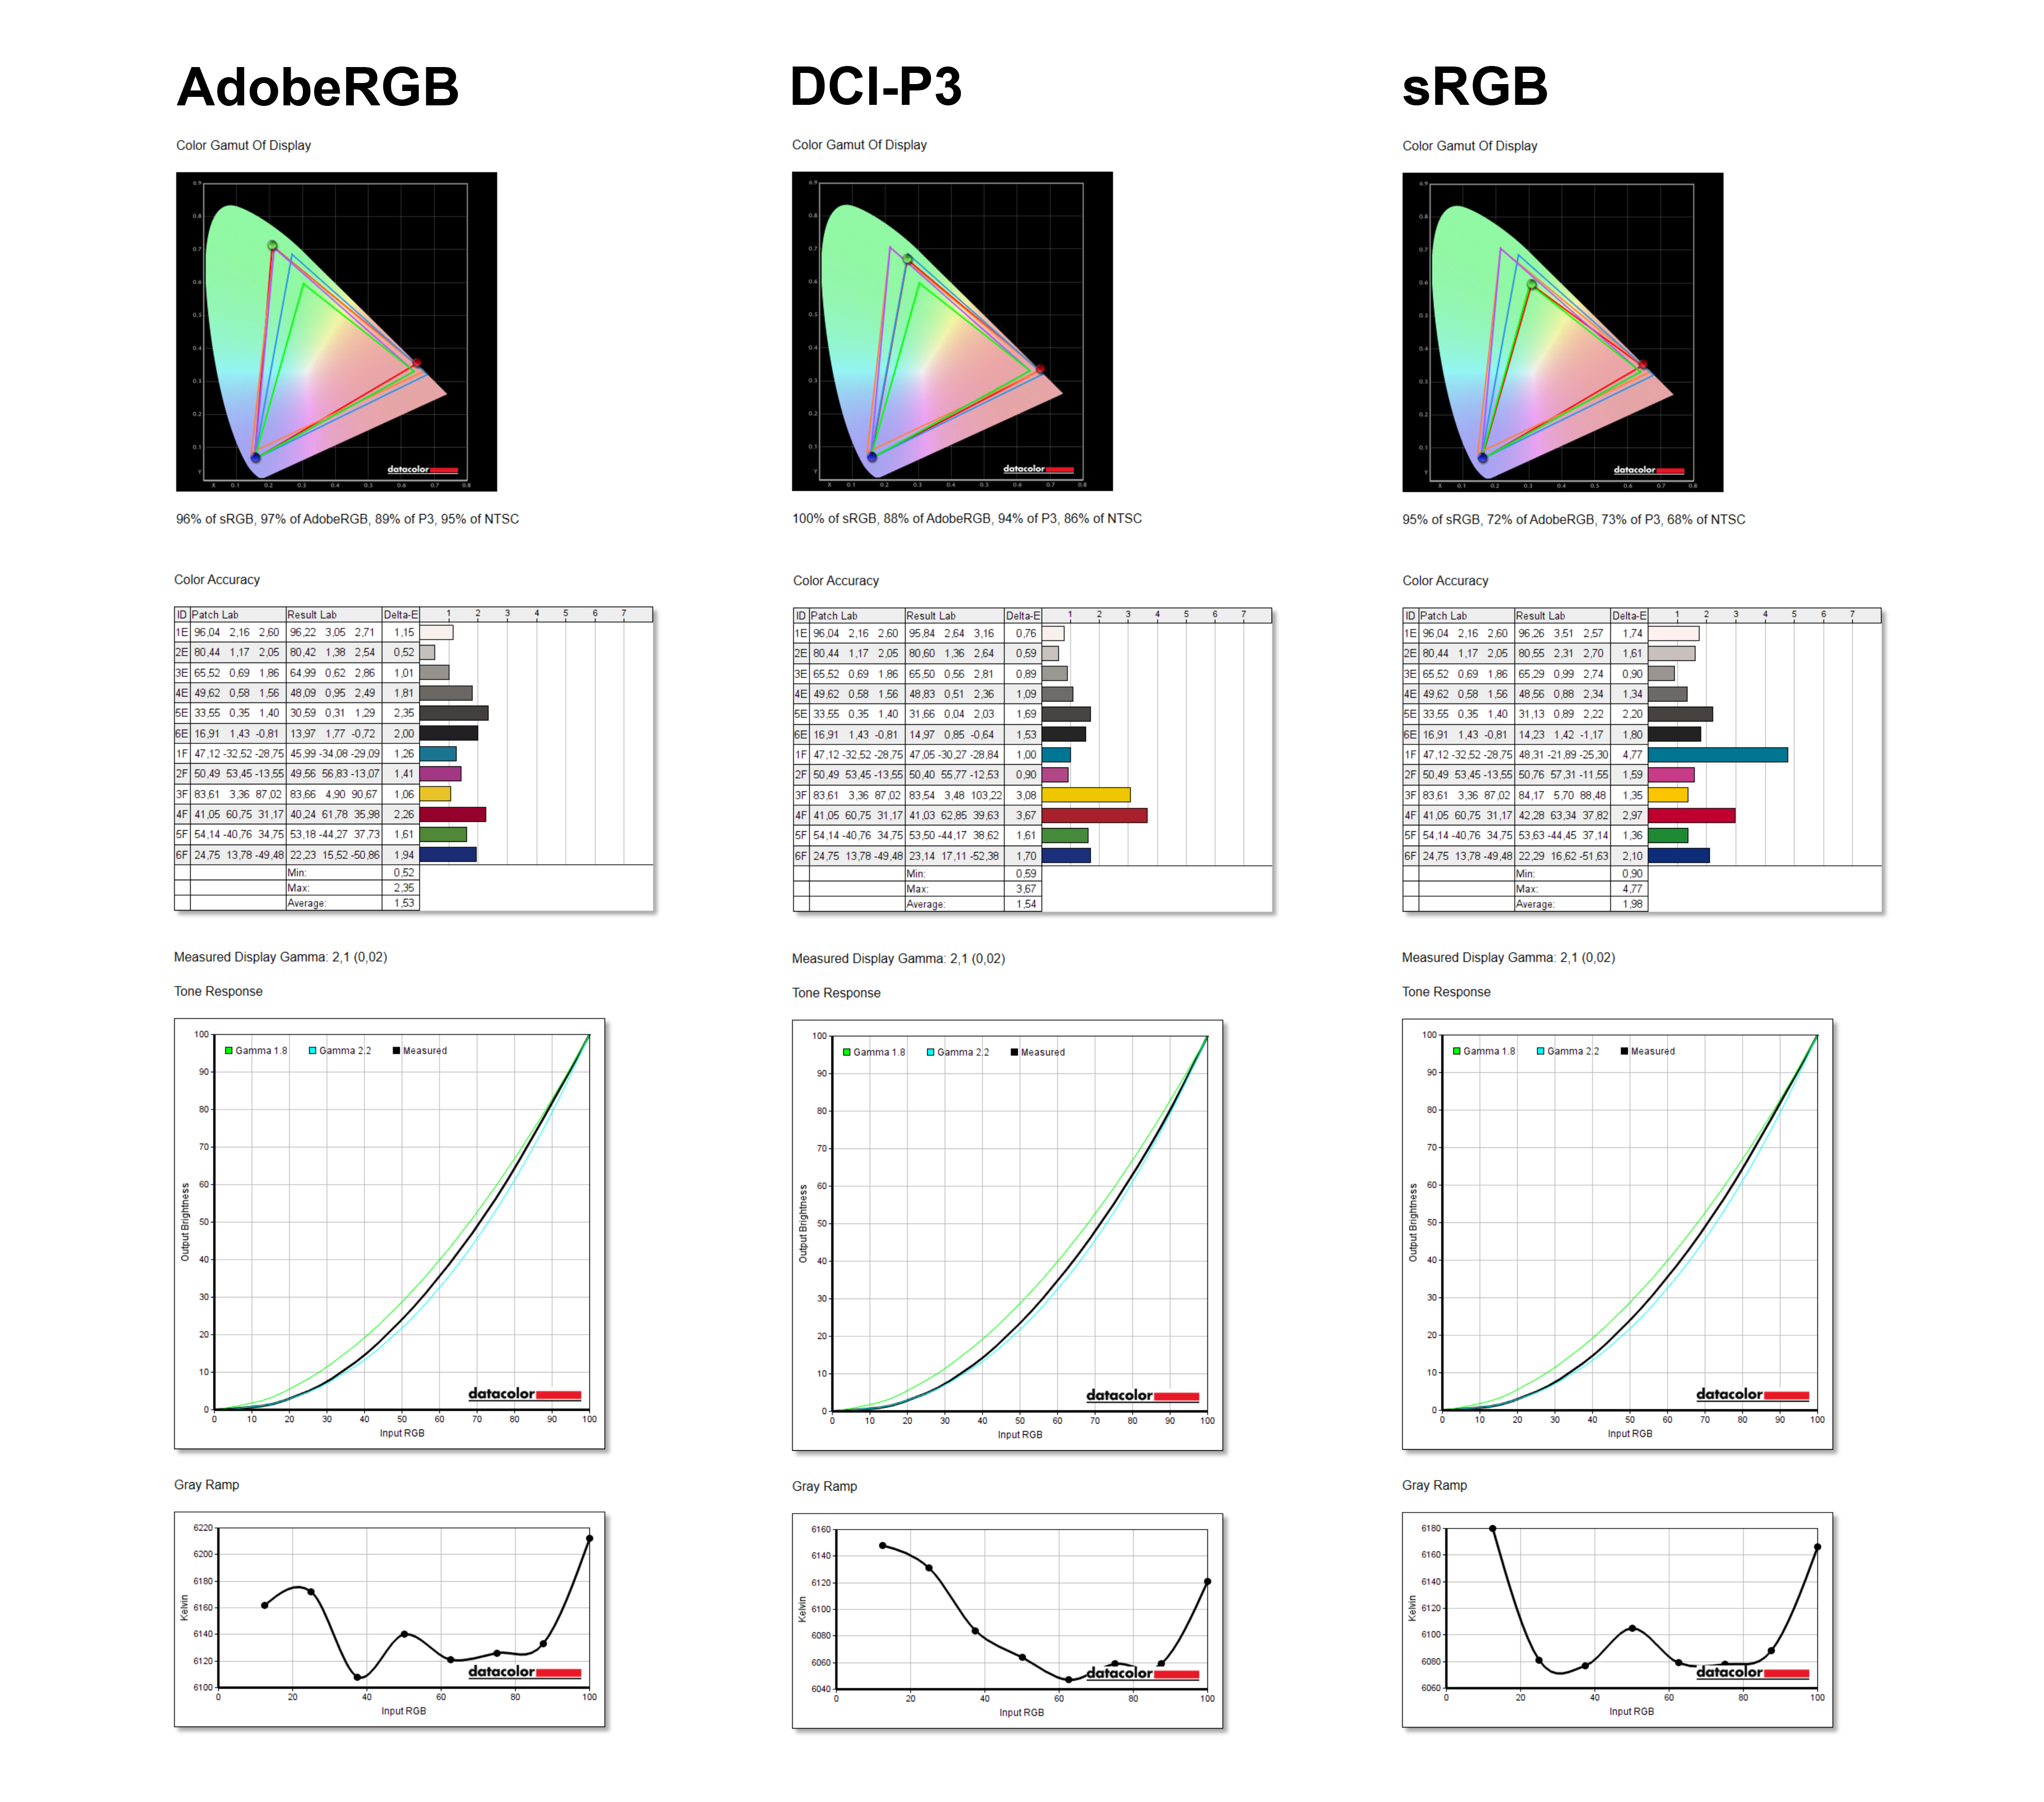
We also tested dedicated modes, which slightly adjust the values for the needs of a given mode, which is also nicely visible in the graphical representation of the triangle in the colour spectrum.
The QHD model does similarly well with 100 % sRGB, 100 % Adobe RGB, 97 % DCI-P3 and 100 % NTSC, adding one percent each time in two modes compared to the UHD model. Brightness is a little lower with 385 nits as the maximum measured value, while Delta E is significantly better with a figure of just 0.79. However, the slightly worse uniformity we already saw in the black test is confirmed.
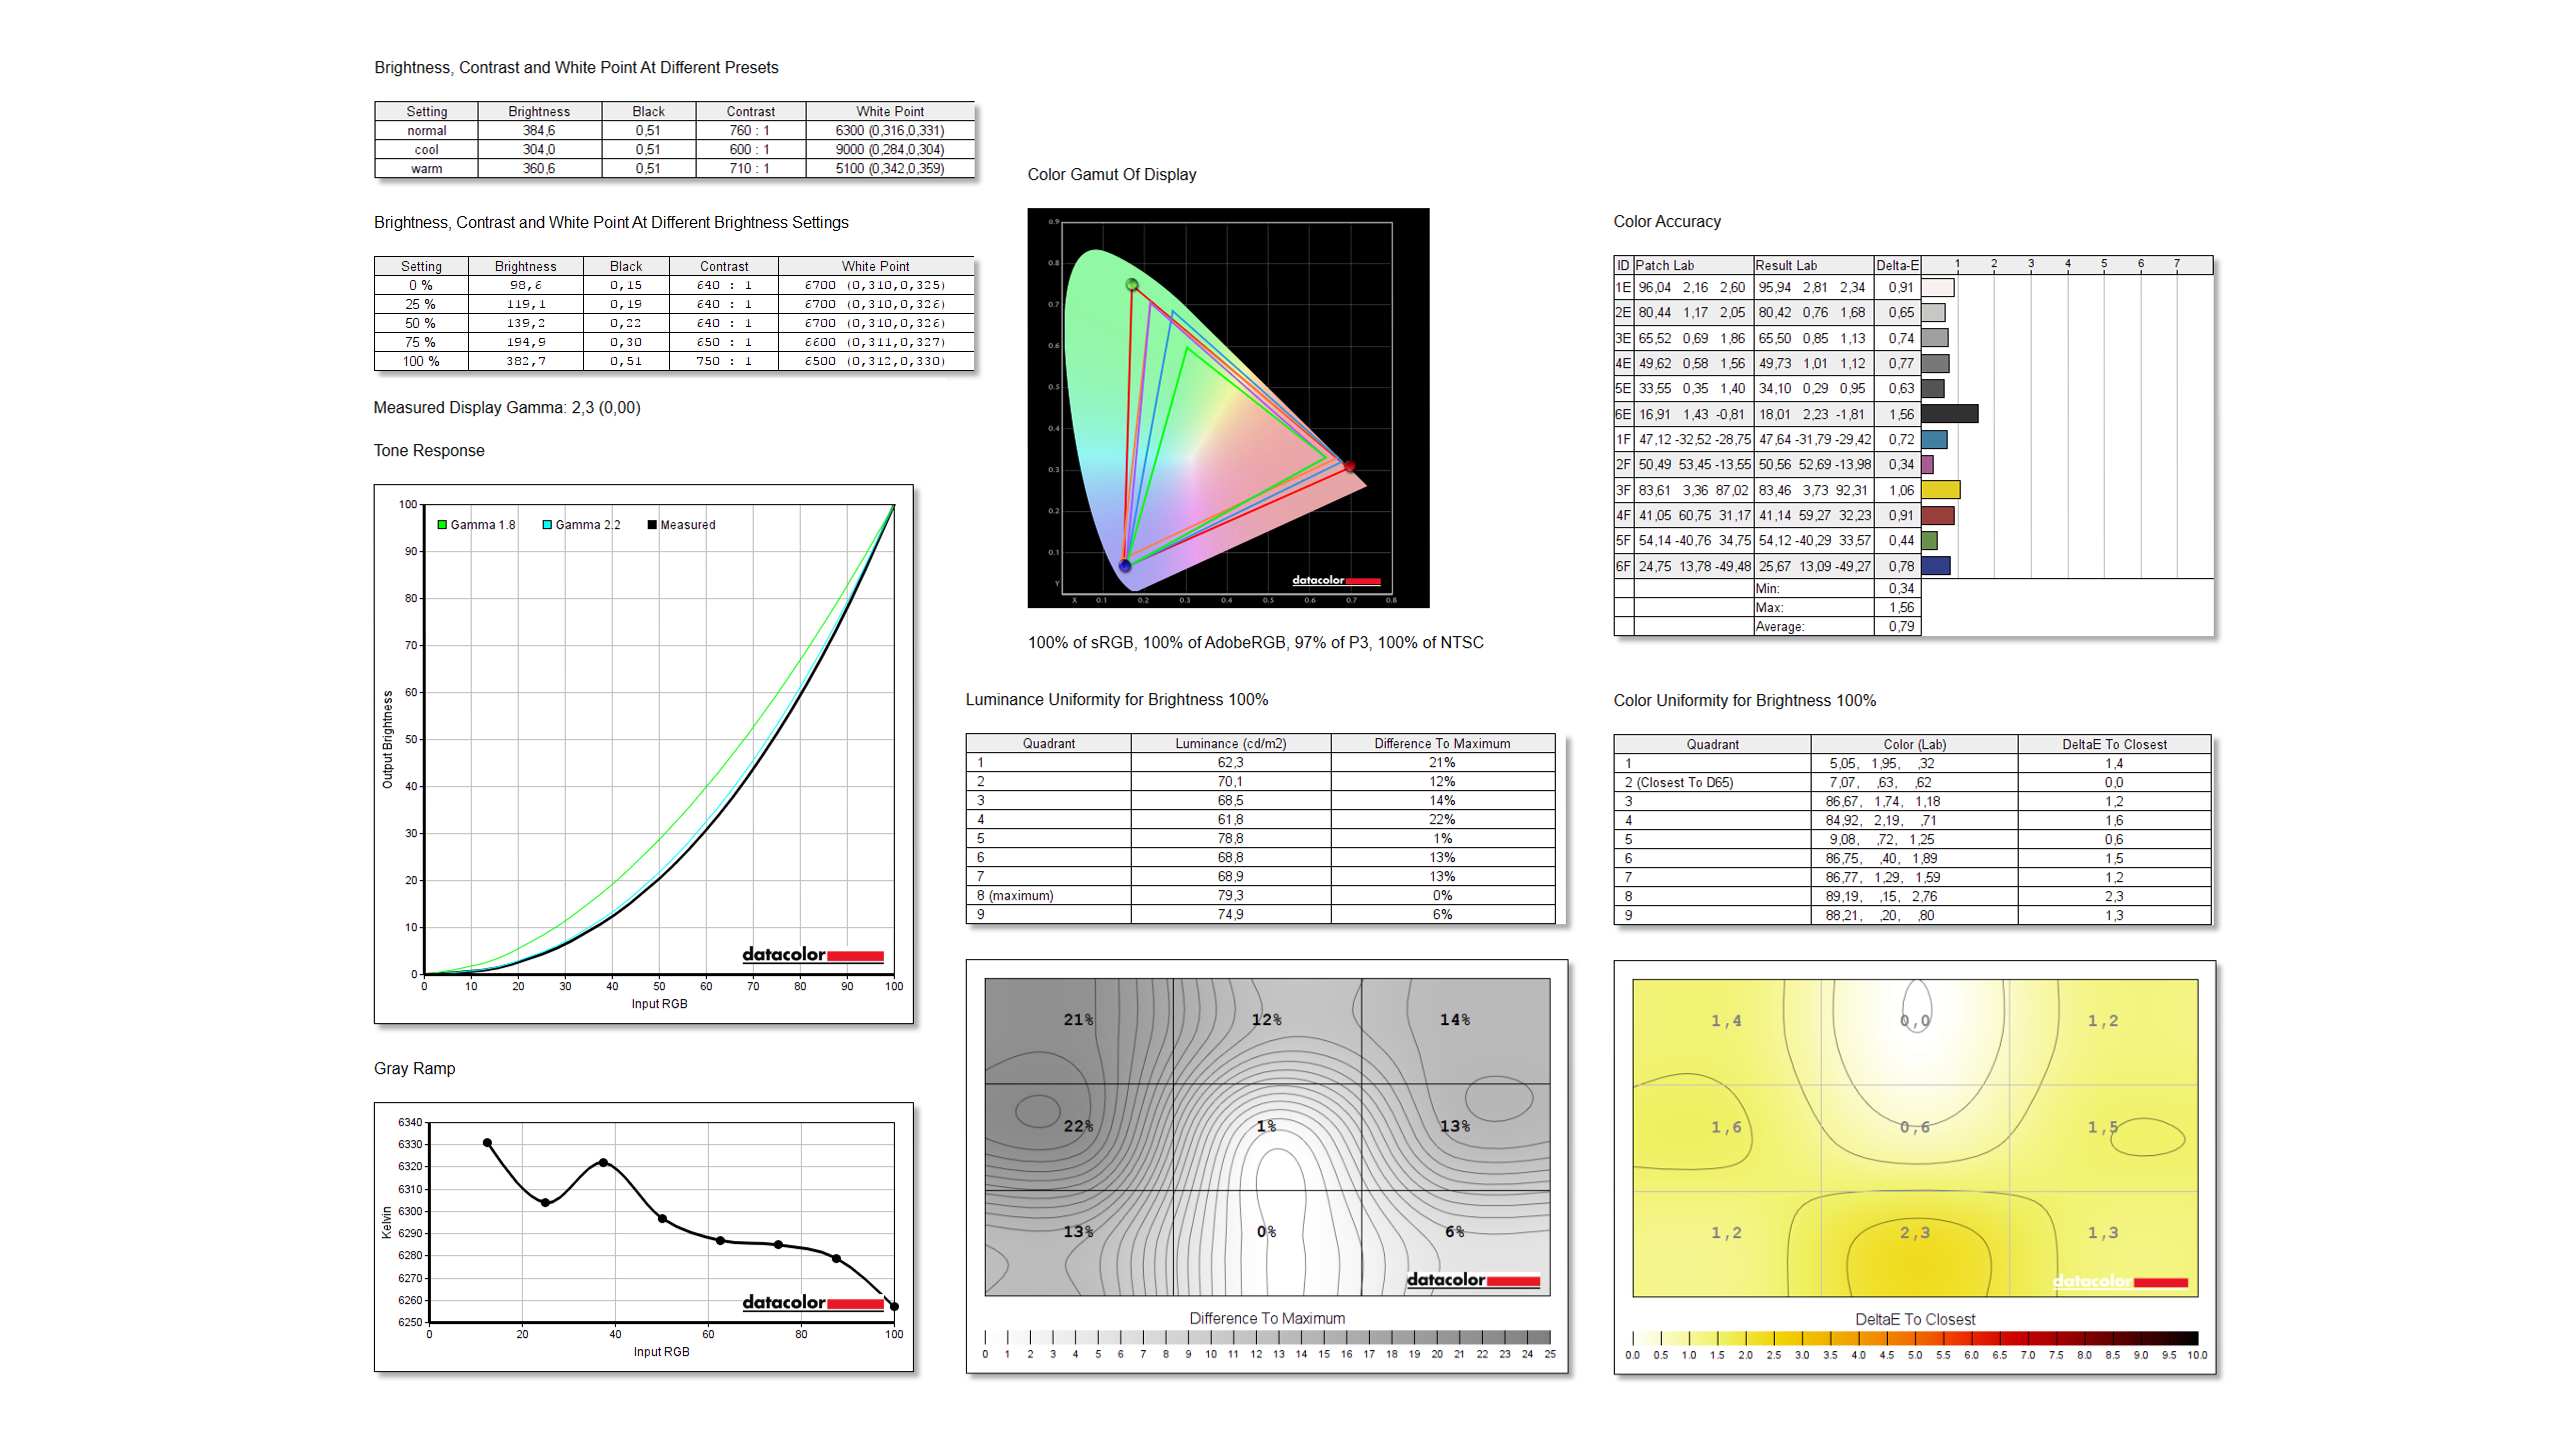
We can observe the correct functioning of the colour profiles here as well, I have no comments on this area.
Input Lag and Response Time
We also measured the input lag on the monitor in multiple Overdrive modes.

The UHD version performs very well with values of 9.8 and 9.5 ms, placing it in the top few percent.

The QHD model is even slightly faster and ranks among the absolute top with 9.2, 9.1 and 9.0 ms.
We could observe very similar results in the UFO ghosting test, where from the factory the default value is Fast mode and not Normal.
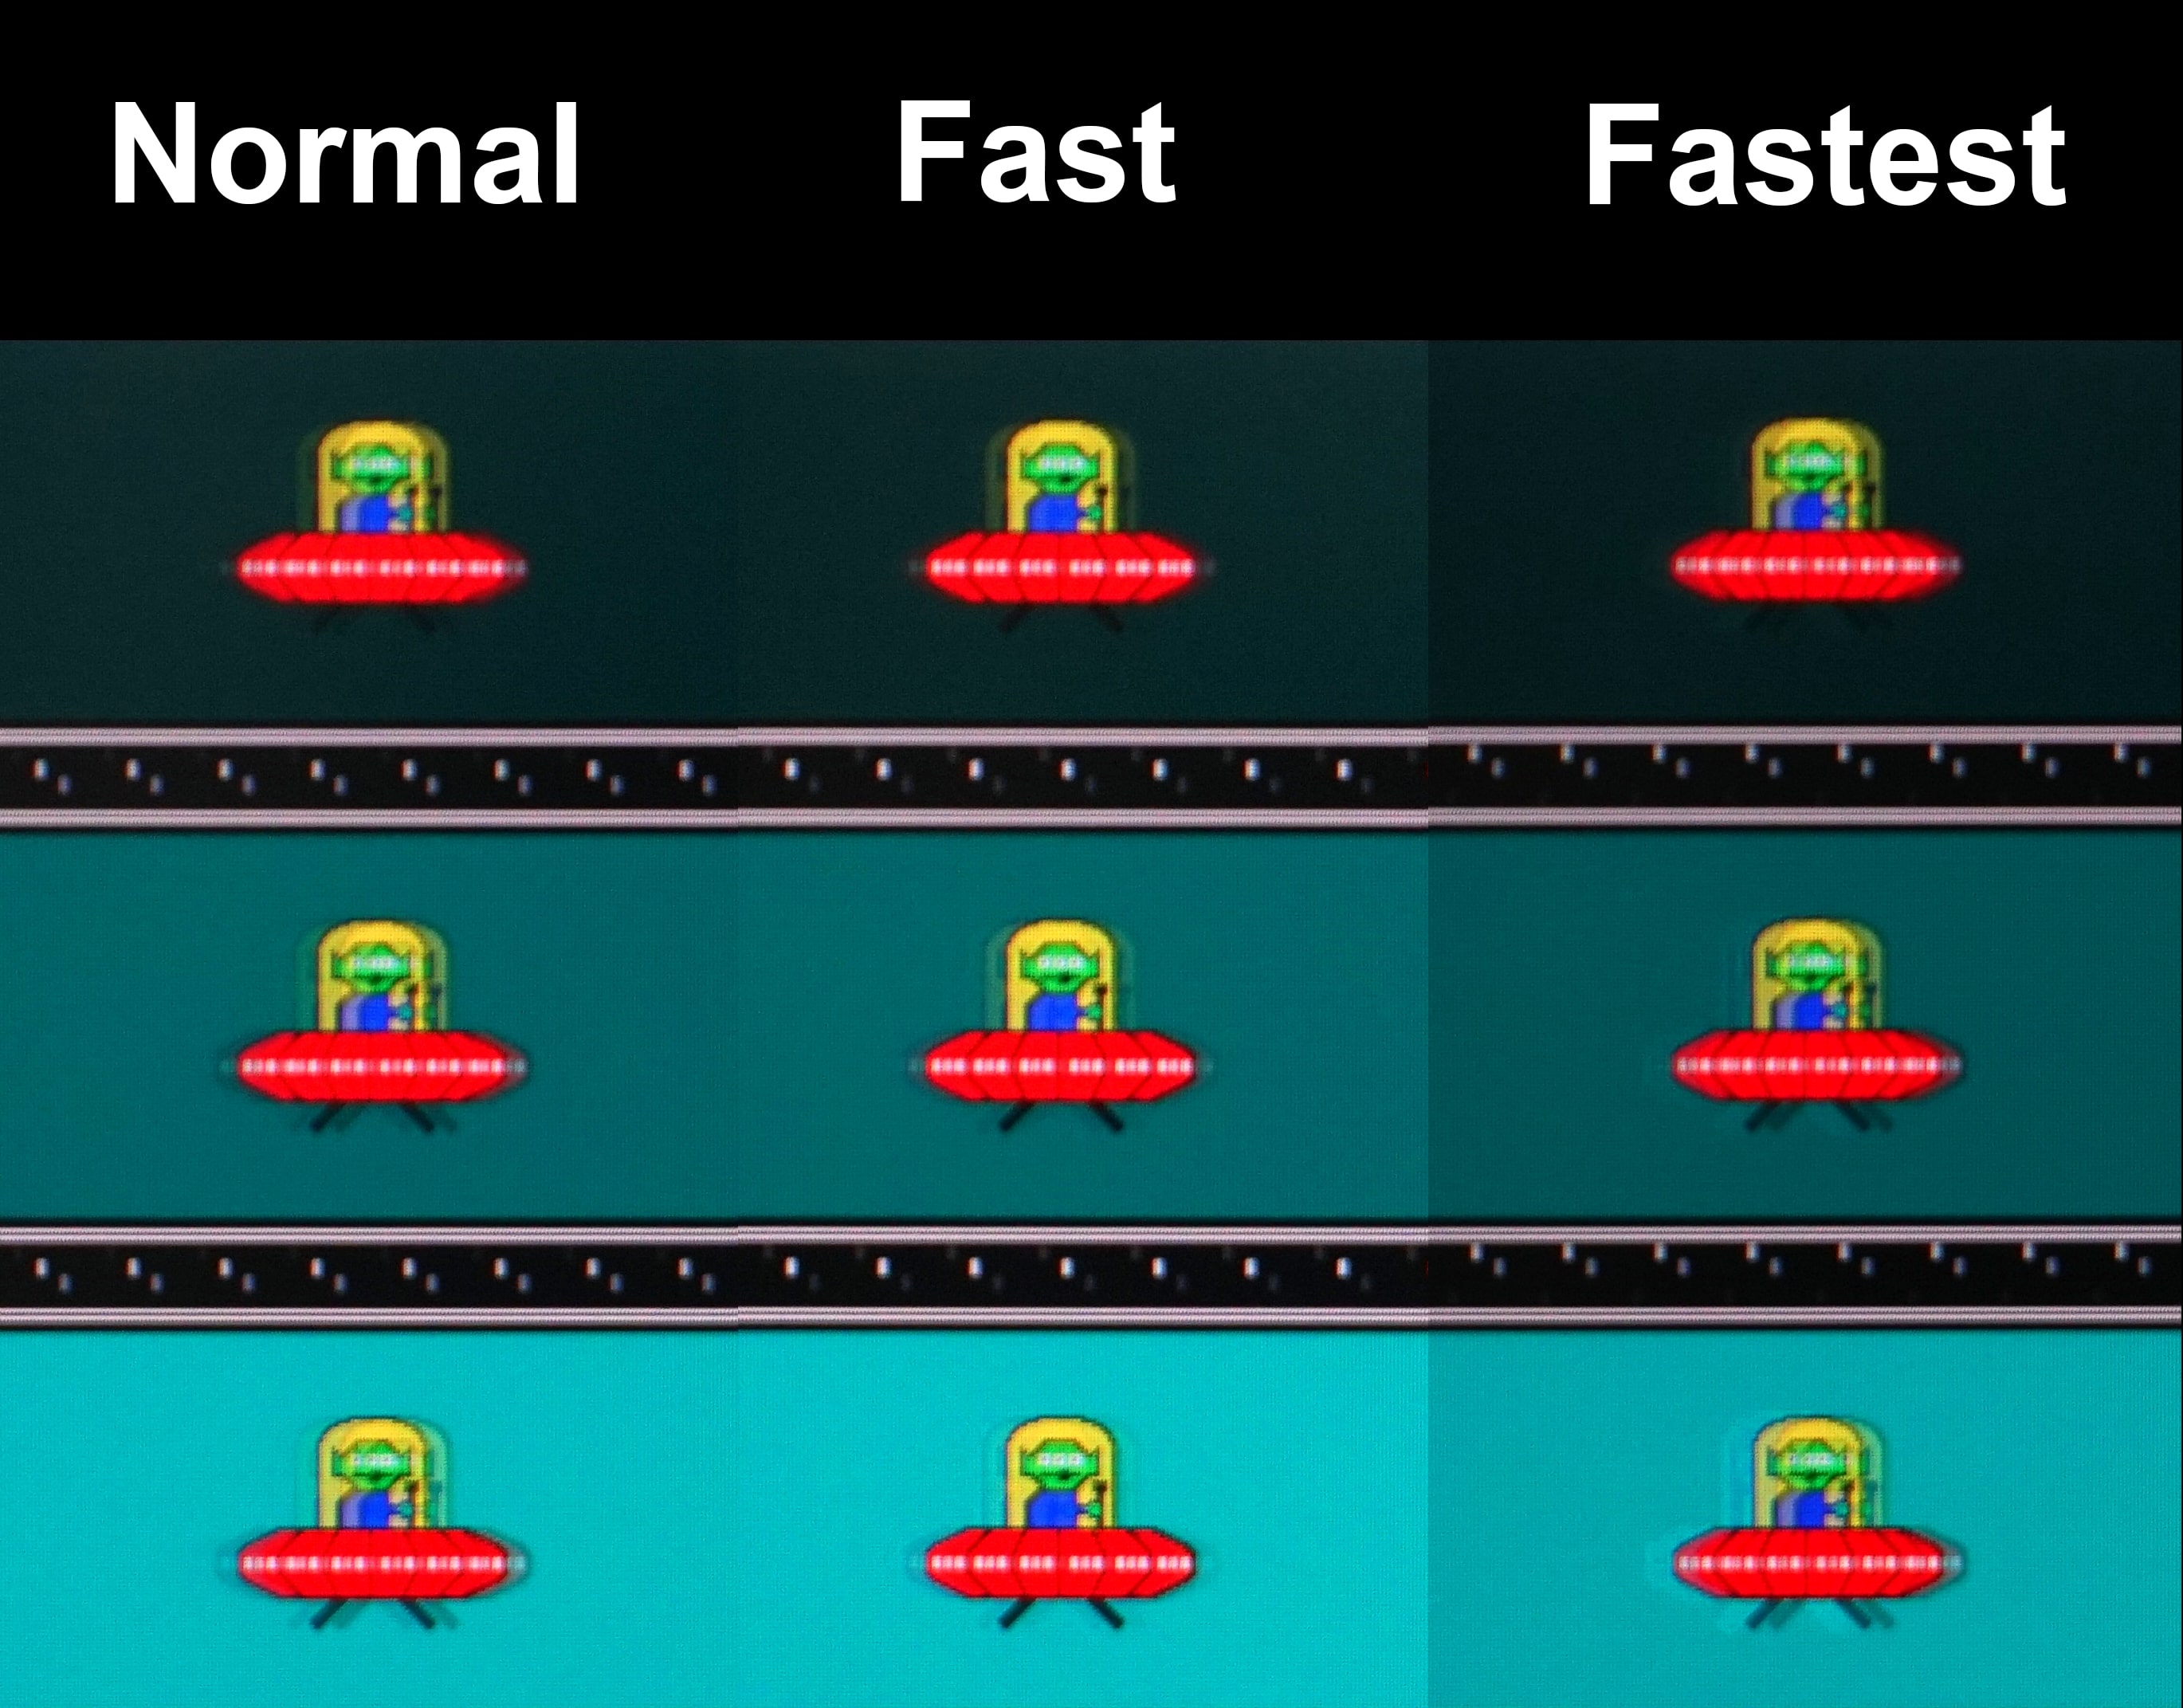
The QHD panel gives a slightly better result thanks to the “Rapid IPS” panel, as it has less visible ghosting in Fast mode than the UHD panel in the image below.

In both cases, Fastest mode is not recommended due to the presence of inverse ghosting.
Power draw
As with the AOC Agon 4 Pro AG324UX test, I measured power draw using the Zeon smart socket in multiple scenarios. In the first test, I looked at the power draw on the Windows desktop after resetting the monitor’s settings, so again, the baseline state the monitor is in when you first take it out of the box. Here, the socket showed me 44.4W for the UHD model and 37.3W for the QHD version. It’s important to mention that the baseline brightness is 70 %.
I then opened Eizo monitor test, displayed the white colour and measured the power draw at 0 and 10 % brightness. The measured values are 37.7 and 49.5 W for the UHD version, the QHD model had 31.2 and 62.1 W.
Then I opened YouTube and ran 4K HDR video of Costa Rica to test the power draw in HDR mode, here the values varied between 60-85 W depending on the current scene, and that was with both monitors.
The last thing I tried was charging via USB-C. I plugged in a MacBook Pro 14″ that had 50 % battery and waited for it to start charging. The power draw only jumped to 57.6 watts. However, the MacBook was showing that it was charging using 15 W, which is more than the 8 W of the AOC monitor, but not nearly as much as the 90 W charging presented.