


Methodology: performance tests
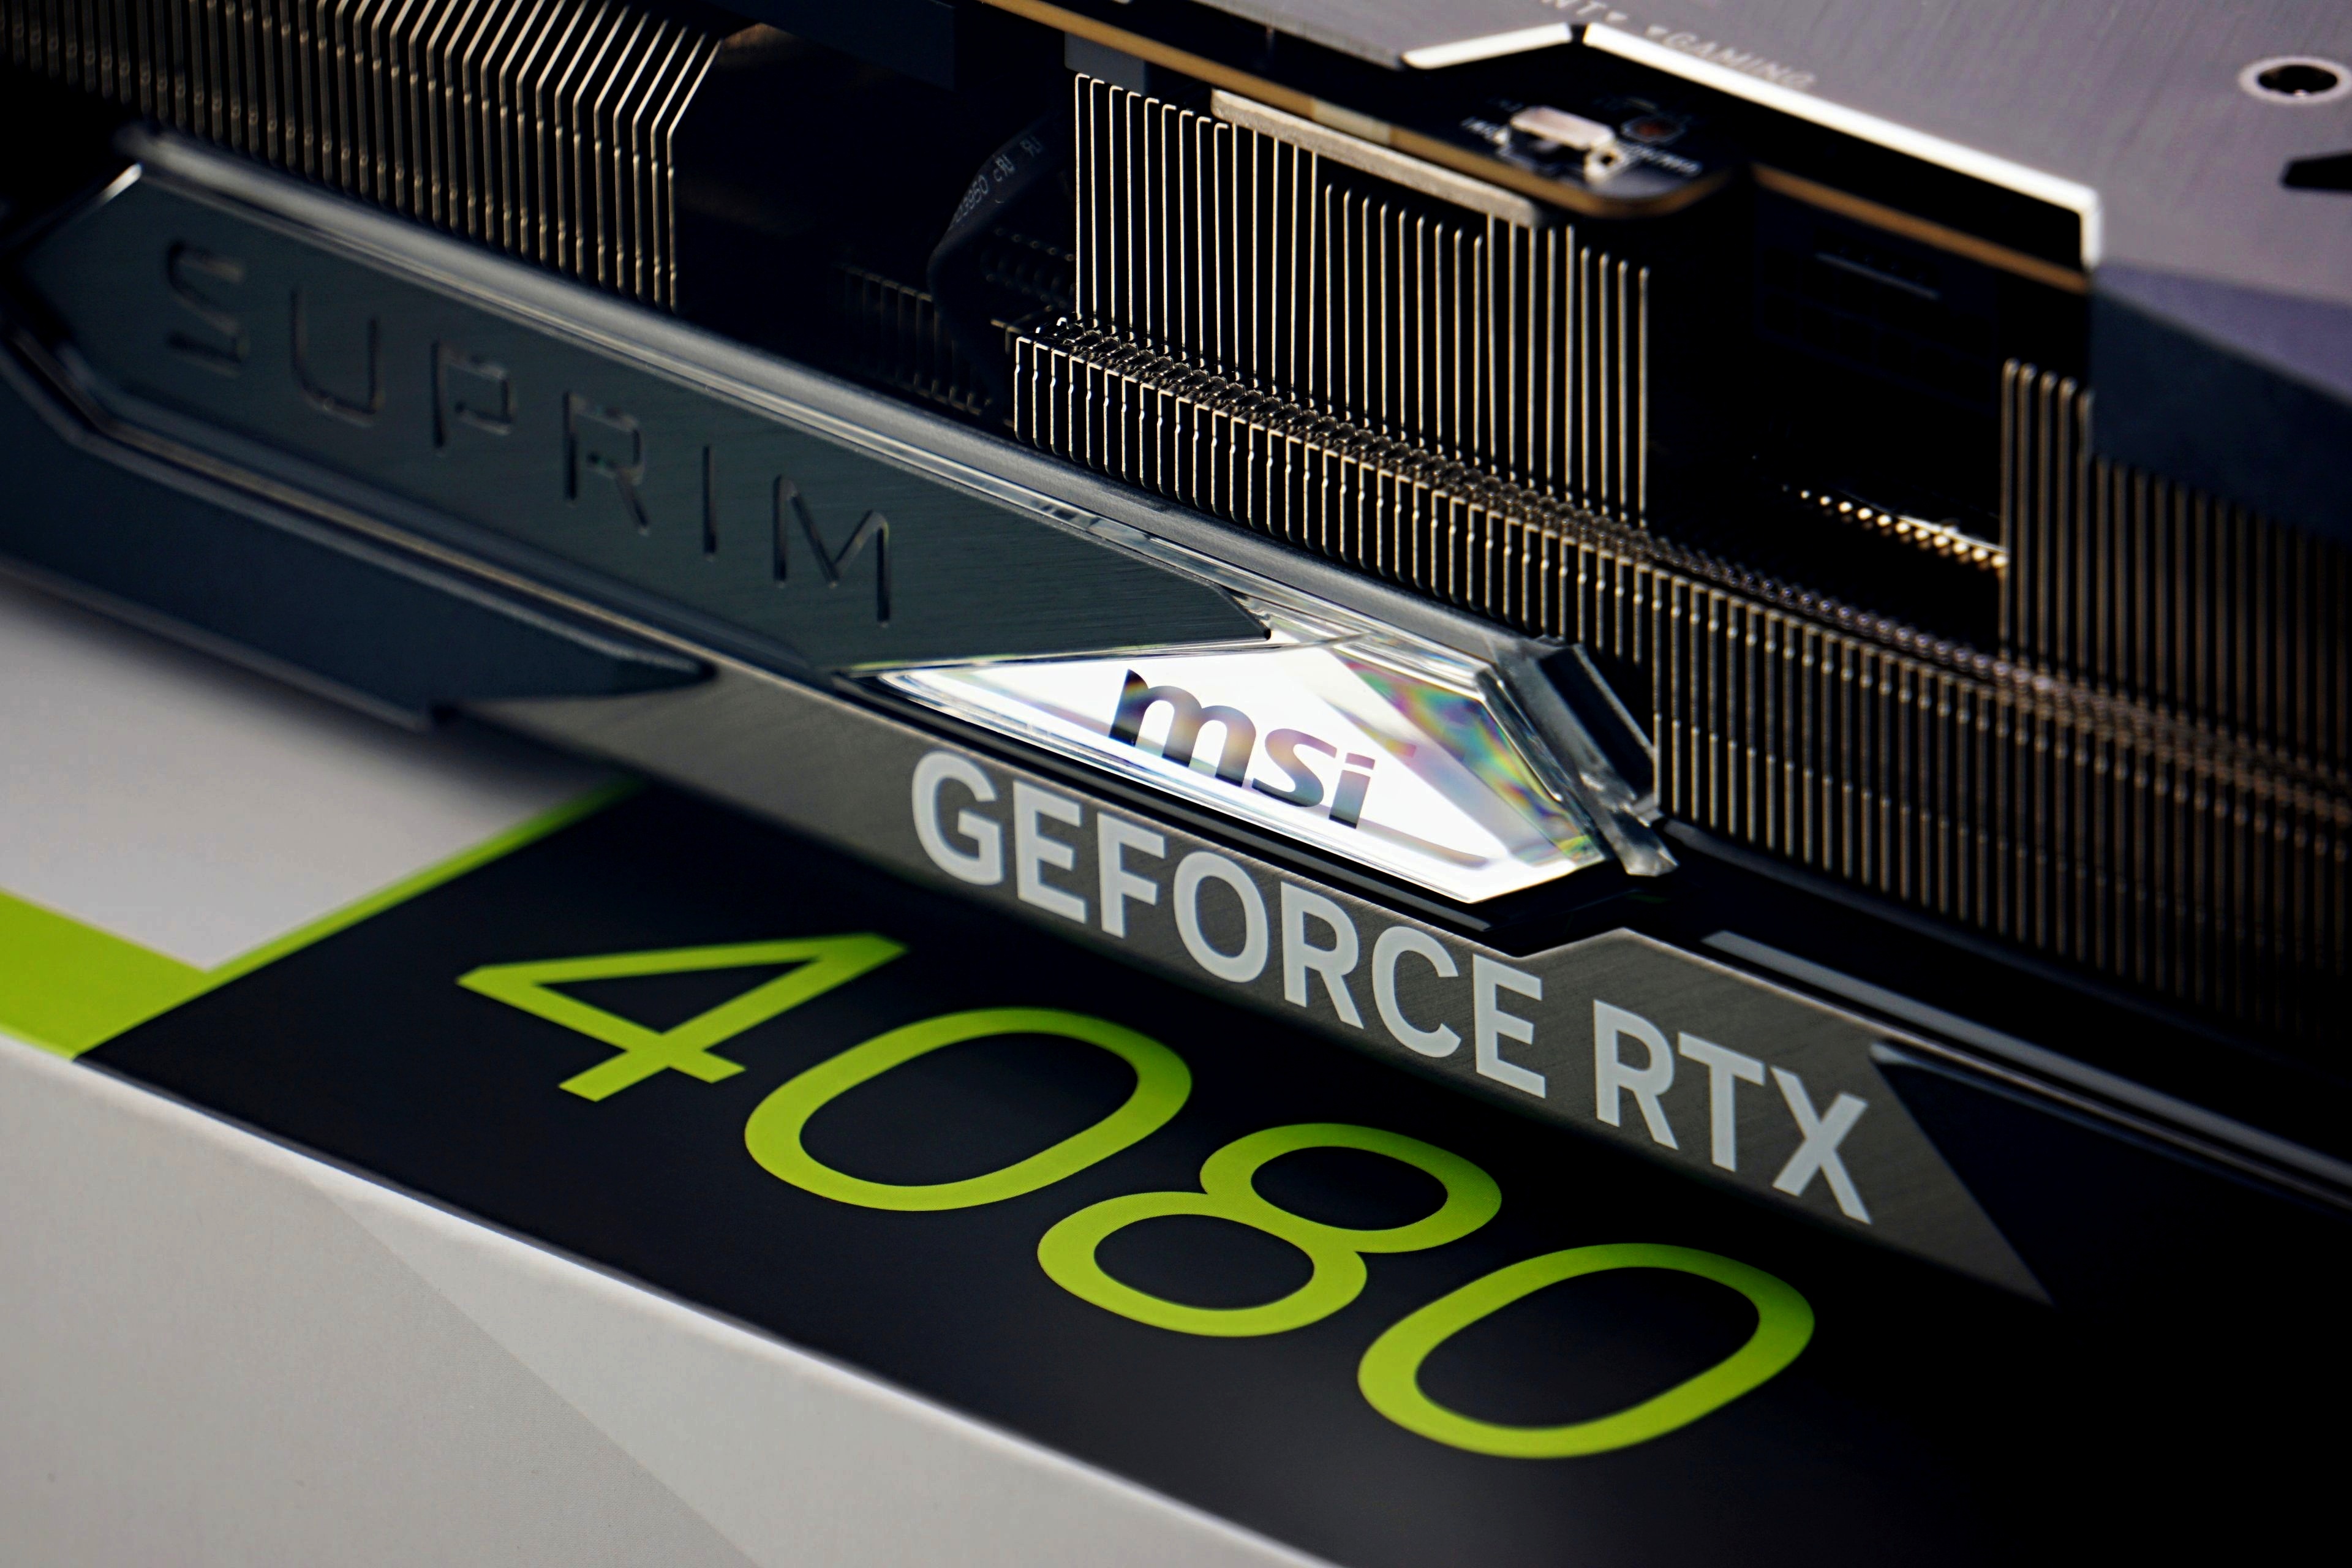
From Olympus back to ordinary mortals. Though the GeForce RTX 4080s are quite a bit weaker than the RTX 4090s, they’re also significantly more power-efficient and cheaper. And their performance still exceeds the top models of previous generations of Nvidia and AMD gaming GPUs. In addition, MSI’s most powerful model – the Suprim X – pushes the GPU clock speeds very high, while efficiency is still top-notch.
Gaming tests
The largest sample of tests is from games. This is quite natural given that GeForce and Radeons, i.e. cards primarily intended for gaming use, will mostly be tested.
We chose the test games primarily to ensure the balance between the titles better optimized for the GPU of one manufacturer (AMD) or the other one (Nvidia). But we also took into account the popularity of the titles so that you could find your own results in the charts. Emphasis was also placed on genre diversity. Games such as RTS, FPS, TPS, car racing as well as a flight simulator, traditional RPG and sports games are represented by the most played football game. You can find a list of test games in the library of chapters (9–32), with each game having its own chapter, sometimes even two (chapters) for the best possible clarity, but this has its good reason, which we will share with you in the following text.
Before we start the gaming tests, each graphics card will pass the tests in 3D Mark to warm up to operating temperature. That’s good synthetics to start with.
We’re testing performance in games across three resolutions with an aspect ratio of 16:9 – FHD (1920 × 1080 px), QHD (2560 × 1440 px) and UHD (3840 × 2160 px) and always with the highest graphic settings, which can be set the same on all current GeForce and Radeon graphics cards. We turned off proprietary settings for the objectivity of the conclusions, and the settings with ray-tracing graphics are tested separately, as lower class GPUs do not support them. You will find their results in the complementary chapters. In addition to native ray-tracing, also after deploying Nvidia DLSS (2.0) and AMD FidelityFX CAS.
If the game has a built-in benchmark, we use that one (the only exception is Forza Horizon 4, where due to its instability – it used to crash here and there – we drive on our track), in other cases the measurements take place on the games’ own scenes. From those we capture the times of consecutive frames in tables (CSV) via OCAT, which FLAT interprets into intelligible fps speech. Both of these applications are from the workshop of colleagues from the gpureport.cz magazine. In addition to the average frame rate, we also write the minimum in the graphs. That contributes significantly to the overall gaming experience. For the highest possible accuracy, all measurements are repeated three times and the final results form their average value.
Computational tests
Testing the graphics card comprehensively, even in terms of computing power, is more difficult than drawing conclusions from the gaming environment. Just because such tests are usually associated with expensive software that you don’t just buy for the editorial office. On the other hand, we’ve found ways to bring the available computing performance to you. On the one hand, thanks to well-built benchmarks, there are also some freely available and at the same time relevant applications, and thirdly, we have invested something in the paid ones.
The tests begin with ComputeBench, which computes various simulations (including game graphics). Then we move on to the popular SPECviewperf benchmark (2020), which integrates partial operations from popular 2D and 3D applications, including 3Ds max and SolidWorks. Details on this test package can be found at spec.org. From the same team also comes SPECworkstation 3, where GPU acceleration is in the Caffe and Folding@Home tests. You can also find the results of the LuxMark 3.1 3D render in the graphs, and the remarkable GPGPU theoretical test also includes AIDA64 with FLOPS, IOPS and memory speed measurements.
For obvious reasons, 3D rendering makes the largest portion of the tests. This is also the case, for example, in the Blender practical tests (2.91). In addition to Cycles, we will also test the cards in Eevee and radeon ProRender renderers (let AMD have a related test, as most are optimized for Nvidia cards with proprietary CUDA and OptiX frameworks). Of course, an add-on for V-ray would also be interesting, but at the moment the editorial office can’t afford it, we may manage to get a “press” license in time, though, we’ll see. We want to expand application tests in the future. Definitely with some advanced AI testing (we haven’t come up with a reasonable way yet), including noise reduction (there would be some ideas already, but we haven’t incorporated those due to time constraints).

Graphics cards can also be tested well in photo editing. To get an idea of the performance in the popular Photoshop, we’re using a script in PugetBench, which simulates real work with various filters. Among them are those that use GPU acceleration. A comprehensive benchmark suggesting the performance of raster and vector graphics is then also used in alternative Affinity Photo. In Lightroom, there are remarkable color corrections (Enhance Details) of raw uncompressed photos. We apply these in batches to a 1 GB archive. All of these tasks can be accelerated by both GeForce and Radeon.
From another perspective, there are decryption tests in Hashcat with a selection of AES, MD5, NTLMv2, SHA1, SHA2-256/512 and WPA-EAPOL-PBKDF2 ciphers. Finally, in the OBS and XSplit broadcast applications, we measure how much the game performance will be reduced while recording. It is no longer provided by shaders, but by coders (AMD VCE and Nvidia Nvenc). These tests show how much spare performance each card has for typical online streaming.
There are, of course, more hardware acceleration options, typically for video editing and conversion. However, this is purely in the hands of encoders, which are always the same within one generation of cards from one manufacturer, so there is no point in testing them on every graphics card. It is different across generations and tests of this type will sooner or later appear. Just fine-tuning the metric is left, where the output will always have the same bitrate and pixel match. This is important for objective comparisons, because the encoder of one company/card may be faster in a particular profile with the same settings, but at the expense of the lower quality that another encoder has (but may not have, it’s just an example).
New: As of November 18, 2022, we are testing all graphics cards only in Resizable BAR active mode. There are three reasons why we will not continue with measurements without ReBAR.
The main reason is that new motherboards starting with Intel Z790 and AMD X670(E) chipset models already have it enabled, which wasn’t the case before, and the PCIe settings required ReBAR to be enabled manually. So those who don’t turn it off will be running with ReBAR active, which is a good thing from a gaming perspective where it adds performance. This is perhaps to some extent because Intel graphics cards without ReBAR don’t seem to behave correctly, and there will probably be more and more graphics cards that count on it in the future. You already know the number two reason for ReBAR-only tests.
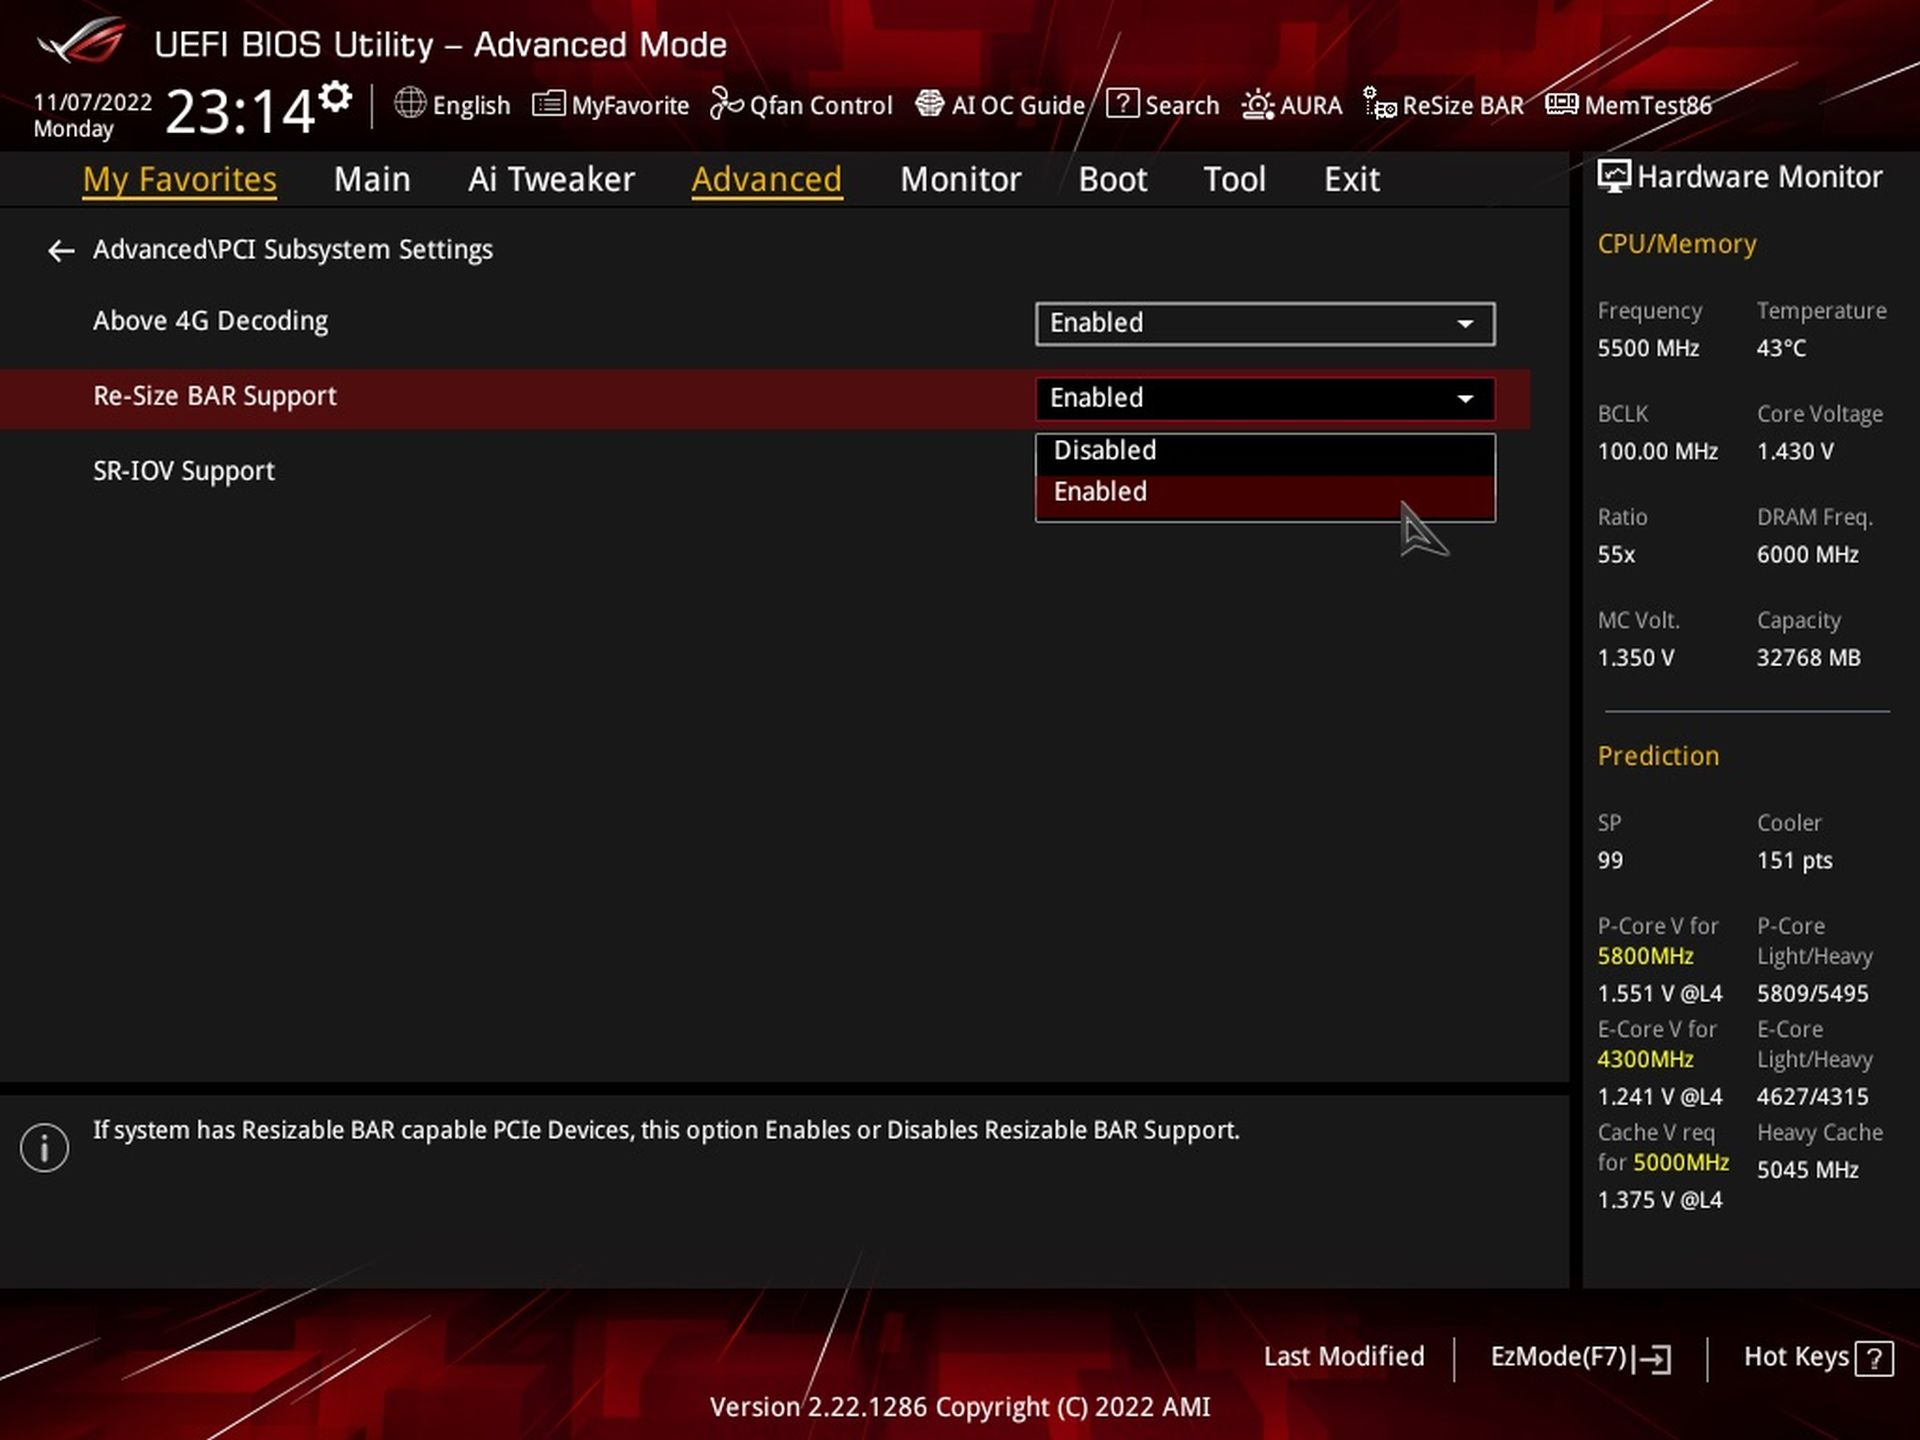
Finally, it is also true that testing all tests twice (with and without ReBAR) with triple repeatability is extremely time consuming. However, it is still true what we have argued many times – a platform with ReBAR is less stable when it comes to measurement results. Over time, some things may change in the debugging process (from driver to driver) and may not “make sense” when compared to each other. So when you see somewhere that in other tests a slower card outperforms a more powerful one in some particular case, remember these words.
The disadvantage of measurements with active ReBAR is, in short, that all comparison tests may not always be perfectly consistent. And it is possible that there will continue to be cases where ReBAR reduces performance rather than adding to it. These are things to be reckoned with when studying results. This applies not only to our tests, but to the tests of all the others who do not retest all the older models in comparison with every new graphics card tested.
- Contents
- MSI RTX 4080 16GB Suprim X in detail
- Table of parameters
- Methodology: performance tests
- Methodology: how we measure power draw
- Methodology: noise and sound measurement
- Methodology: temperature tests
- Test setup
- 3DMark
- Age of Empires II: DE
- Assassin’s Creed: Valhalla
- Battlefield V
- Battlefield V with DXR
- Borderlands 3
- Control
- Control with DXR and DLSS
- Counter-Strike: GO
- Cyberpunk 2077
- Cyberpunk 2077 with DLSS
- Cyberpunk 2077 with DXR (and DXR with DLSS)
- DOOM Eternal
- F1 2020
- FIFA 21
- Forza Horizon 4
- Mafia: DE
- Metro Exodus
- Metro Exodus with DXR and DLSS
- Microsoft Flight Simulator
- Red Dead Redemption 2 (Vulkan)
- Red Dead Redemption 2 (Dx12)
- Shadow of the Tomb Raider
- Shadow of the Tomb Raider with DXR
- Total War Saga: Troy
- Wasteland 3
- Overall gaming performance and performance per euro
- CompuBench (OpenCL)
- SPECviewperf 2020 and SPECworkstation 3
- FLOPS, IOPS and memory speed tests
- 3D rendering 1/2 (LuxMark and Blender@Cycles)
- 3D rendering 2/2 (Blender@Radeon ProRender and Eevee)
- Photo editing (Adobe Photoshop, Lightroom and Affinity Photo)
- Broadcasting (OBS and Xsplit)
- Password cracking
- GPU clock speeds
- GPU and VRAM temperatures
- Net GPU power draw and performance per watt
- Analysis of 12 V branch power supply (higher load)
- Analysis of 12 V branch power supply (lower load)
- Analysis of 3,3 V branch power supply
- Noise level
- Frequency response of sound
- Conclusion


The cooling is not too great. Lower models like 3070 Gaming Trio do operate silently in comparison. Maybe some blame can be attributed to high TDP. Still disappointing to see. Coil whine with 2 high peaks in the traditional frequency area is even more disappointing. MSI seemed to be the way to go for folks who want to avoid bad coil whine. Not anymore.