


Methodology: noise and sound measurement
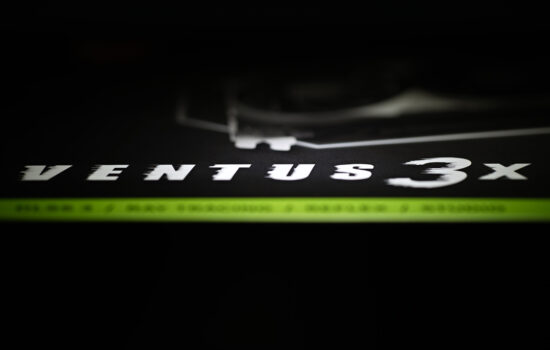
From Olympus back to ordinary mortals. Though the GeForce RTX 4080s are quite a bit weaker than the RTX 4090s, they’re also significantly more power-efficient and cheaper. And their performance still exceeds the top models of previous generations of Nvidia and AMD gaming GPUs. In addition, MSI’s most powerful model – the Suprim X – pushes the GPU clock speeds very high, while efficiency is still top-notch.
Noise measurement…
Noise, as well as other operating characteristics, which we will focus on, we’re measuring in the same modes as consumption, so that the individual values overlap nicely. In addition to the level of noise produced, we also record the frequency response of the sound, the course of the GPU clock speed and its temperature.
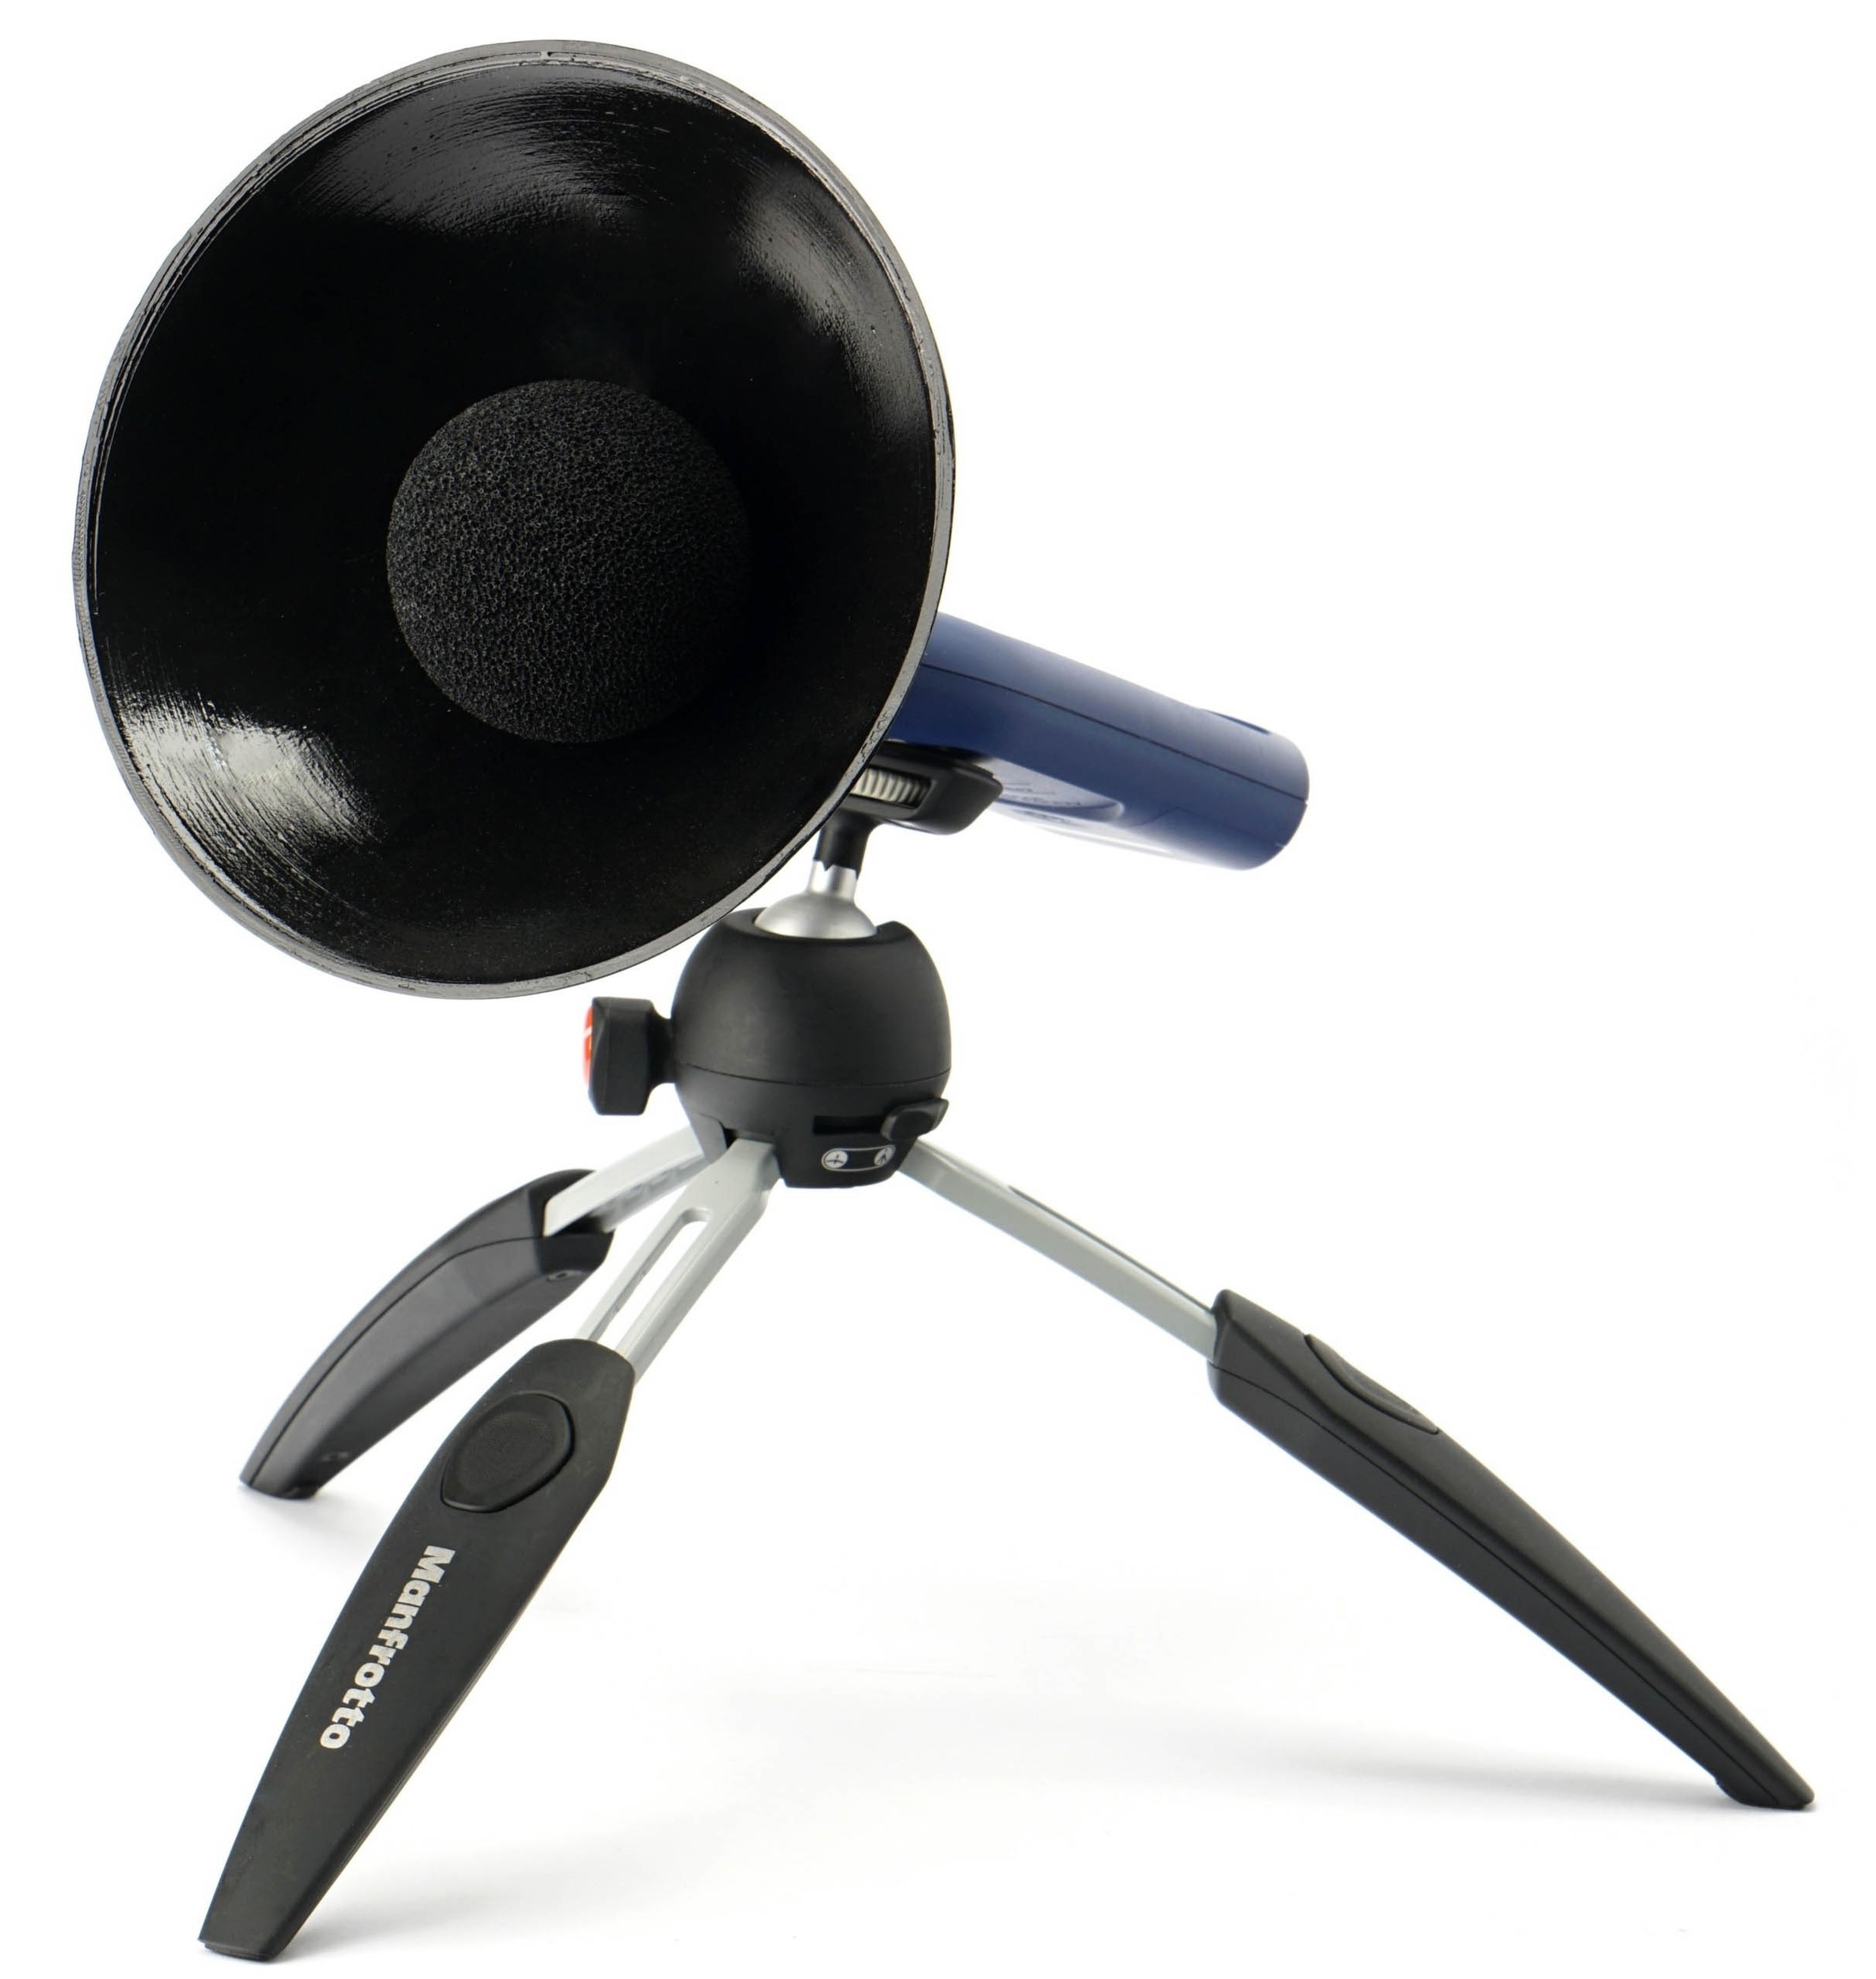
In this part of the methodology description, we will present something about the method of noise measurement. We use a Reed R8080 sound level meter, which we continuously calibrate with a calibrated Voltcraft SLC-100 digital sound level meter. A small addition to the sound level meter is a parabola-shaped collar, which has two functions. Increases the sensitivity to distinguish the sound produced even at very low speeds. It is thus possible to better compare even very quiet cards with the largest possible ratio difference. Otherwise (without this adjustment) it could simply happen that we measured the same noise level across several graphics cards, even though it would actually be a little different. This parabolic shield also makes sense because, from the outer convex side (from the back), it reflects all the parasitic sounds that everyone who really aims for accuracy of the measurements struggles with during the test. These are various cracks of the body or objects in the room during normal human activity.
To ensure the same conditions when measuring the noise level (and later also the sound), we use acoustic panels with a foam surface around the bench-wall. This is so that the sound is always reflected to the sound level meter sensor in the same way, regardless of the current situation of the objects in the test room. These panels are from three sides (top, right and left) and their purpose is to soundproof the space in which we measure the noise of graphics cards. Soundproofing means preventing different reflections of sound and oscillations of waves between flat walls. Don’t confuse it with sound-absorbing, we’ve had that solved well in the test lab for a long time.
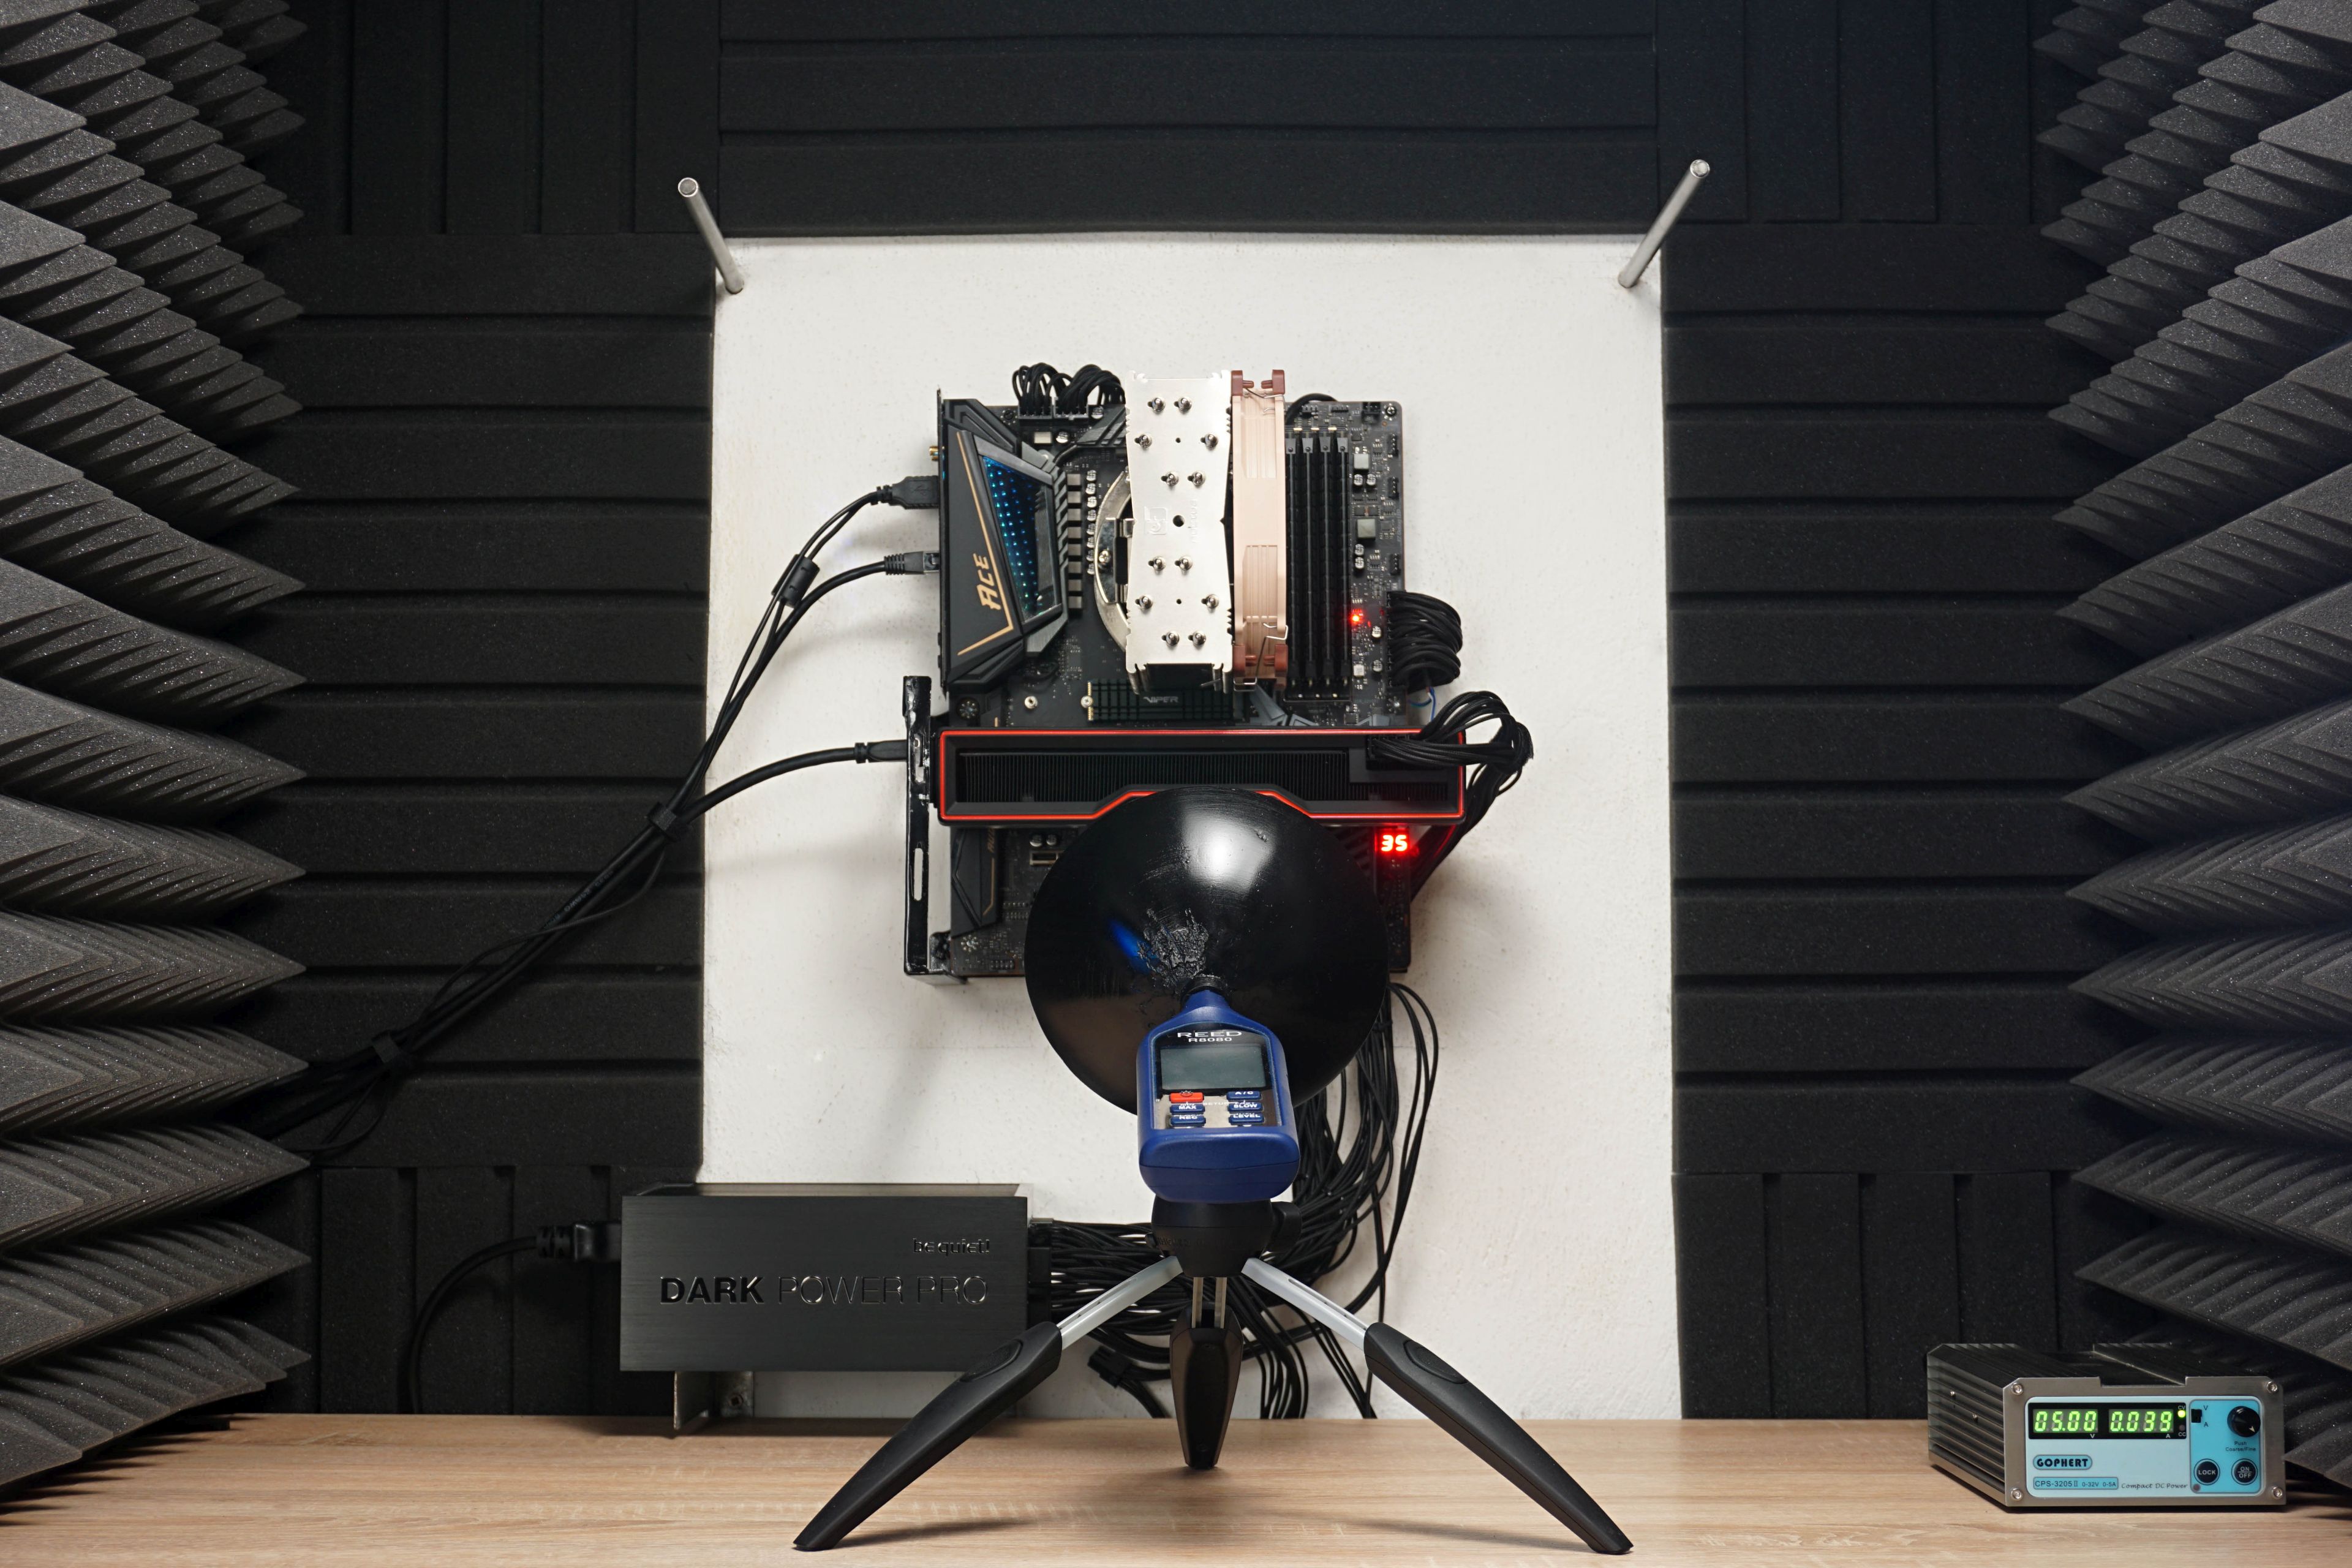
During the measurements, the sound level meter sensor is always placed on a tripod at the same angle and at the same distance (35 cm) from the PCI Express slot in which the graphics card is installed. Of course, it’s always closer to the card itself, depending on its depth. The indicated reference point and the sensor angles are fixed. In addition to the “aerodynamic noise” of the coolers, we also measure the noise level of whining coils. Then we stop the fans for a moment. And for the sake of completeness, it should be added that during sound measurements, we also switch off the power supply fan as well as the CPU cooler fan. Thus, purely the graphics card is always measured without any distortion by other components.
… and the sound frequency response
From the same place, we also measure the frequency of the sound produced. One thing is the noise level (or sound pressure level in decibels) and the other thing is its frequency response.
According to the data on the noise level, you can quickly find out whether the graphics card is quieter or noisier, or where it is on the scale, but it is still a mix of different frequencies. Thus, it does not say whether the sound produced is more booming (with a lower frequency) or squeaking (with a high frequency). The same 35 dBA can be pleasant but also unpleasant for you under certain circumstances – it depends on each individual how they perceive different frequencies. For this reason, we will also measure the frequency response of the sound graphics card in addition to the noise level, via the TrueRTA application. The results will be interpreted in the form of a spectrograph with a resolution of 1/24 octave and for better comparison with other graphics cards we will include the dominant frequency of lower (20–200 Hz), medium (201–2,000 Hz) and higher (2,001–20,000 Hz) sound spectrum into standard bar graphs. For measurements, we’re using a calibrated miniDSP UMIK-1 microphone, which accurately copies the position of the sound level meter, but also has a collar, even with the same focal length.
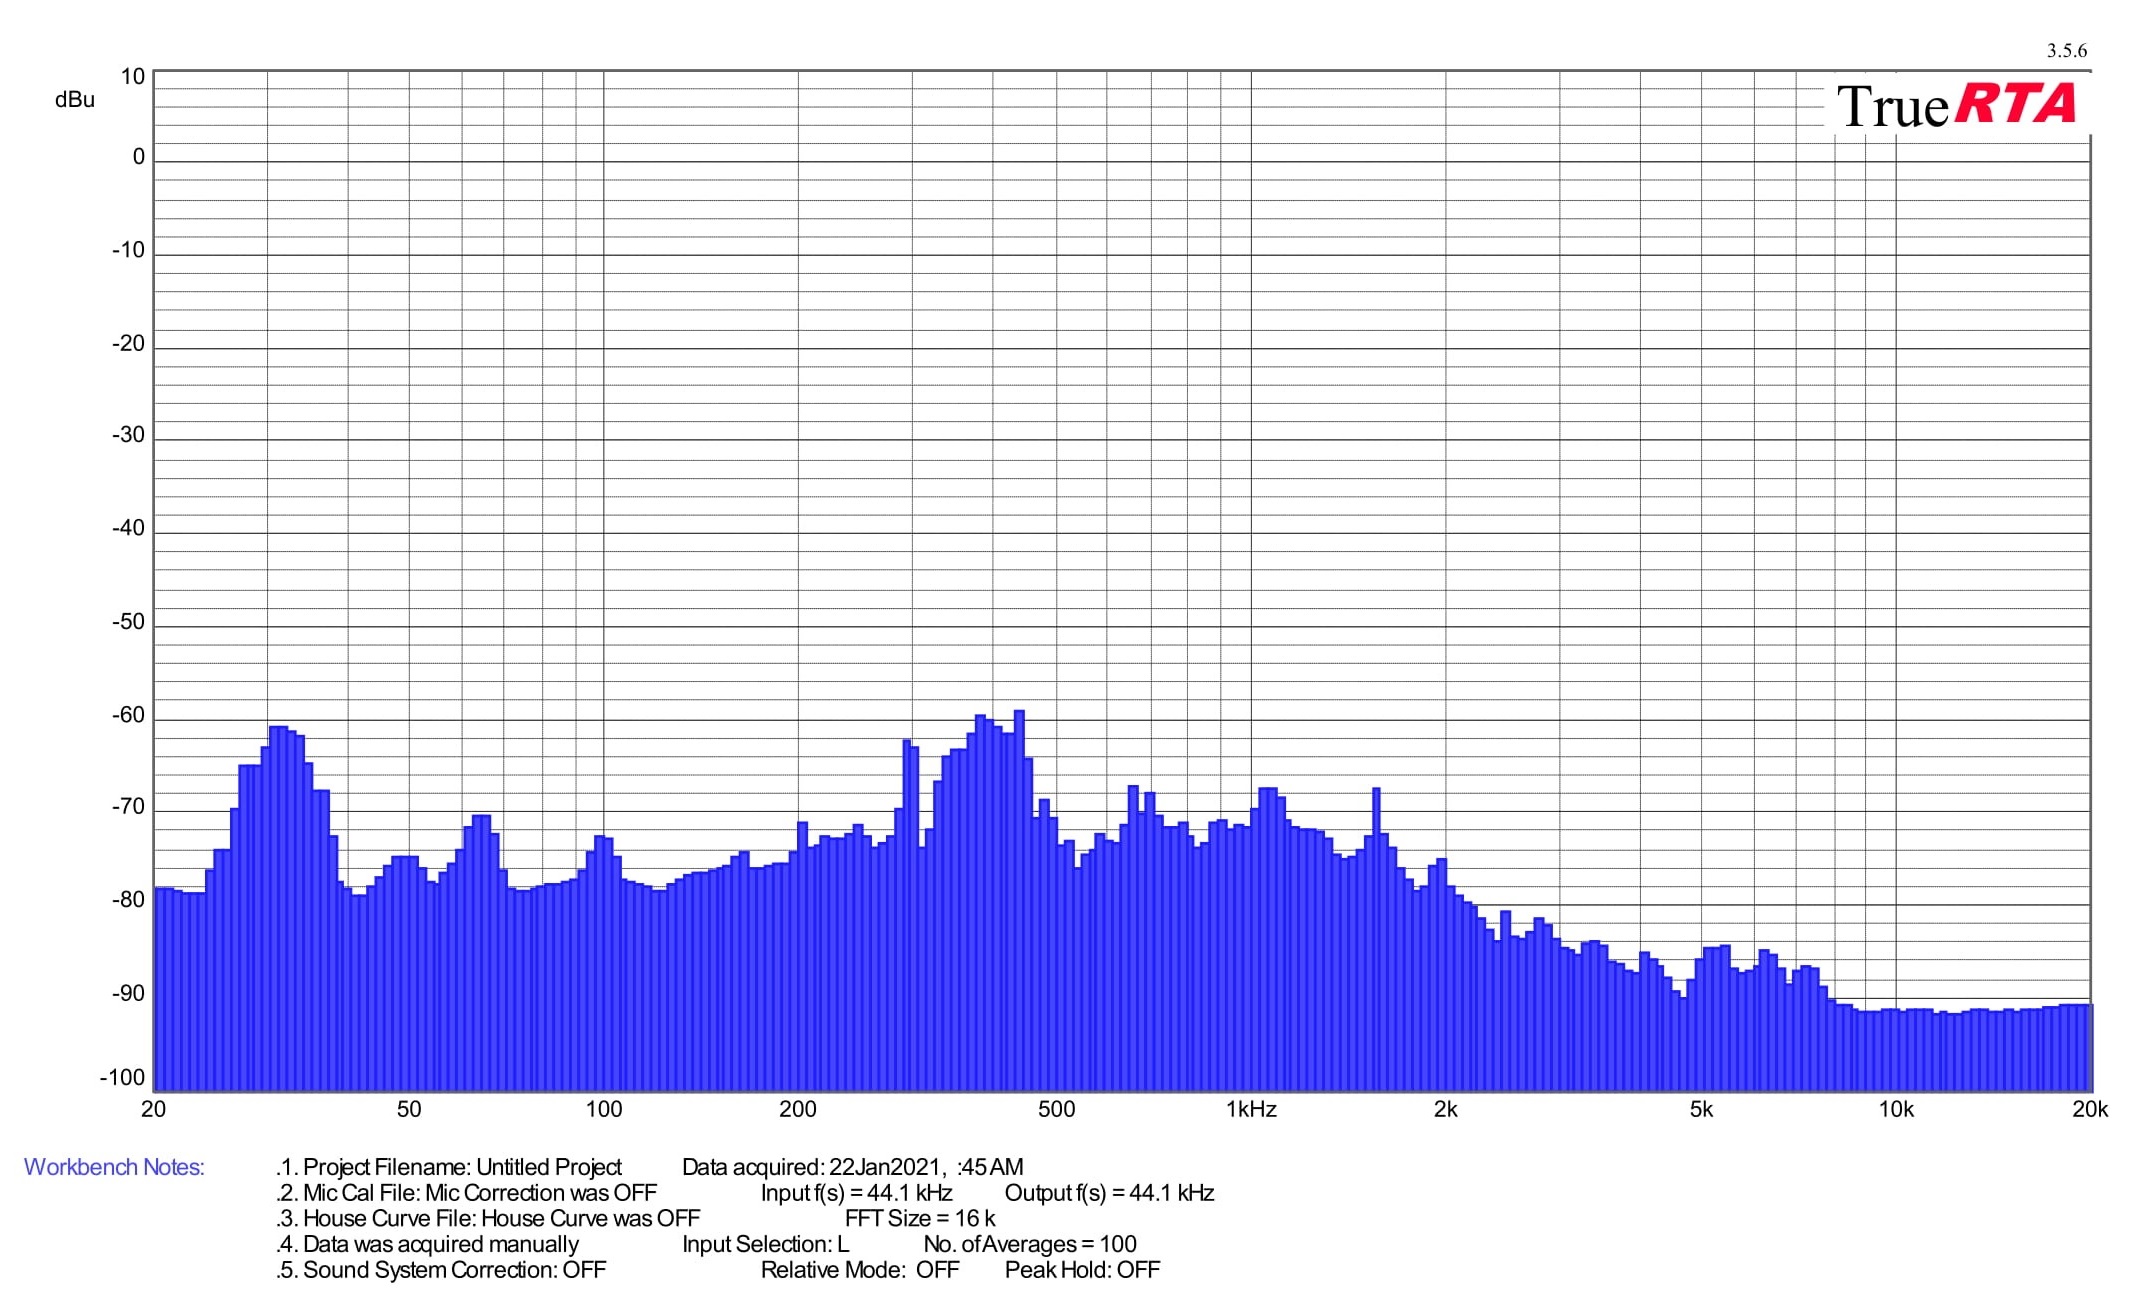
At the end of this chapter, it should be noted that measurements of noise and frequency response of sound will be performed on most cards only in load tests, as out of load and at lower load (including video decoding) operation is usually passive with fans turned off. On the other hand, we must also be prepared for exceptions with active operation in idle or graphics cards with dual BIOS setup, from which the more powerful one never turns off the fans and they run at least at minimum speed. Finally, as with measuring the noise level in one of the tests, we also record the frequency response of whining coils. But don’t expect any dramatic differences here. It will usually be one frequency, and the goal is rather to detect any potential anomalies. The sound of the whining coils is of course variable, depending on the scene, but we always measure in the same scene (in CS:GO@1080p).
- Contents
- MSI RTX 4080 16GB Suprim X in detail
- Table of parameters
- Methodology: performance tests
- Methodology: how we measure power draw
- Methodology: noise and sound measurement
- Methodology: temperature tests
- Test setup
- 3DMark
- Age of Empires II: DE
- Assassin’s Creed: Valhalla
- Battlefield V
- Battlefield V with DXR
- Borderlands 3
- Control
- Control with DXR and DLSS
- Counter-Strike: GO
- Cyberpunk 2077
- Cyberpunk 2077 with DLSS
- Cyberpunk 2077 with DXR (and DXR with DLSS)
- DOOM Eternal
- F1 2020
- FIFA 21
- Forza Horizon 4
- Mafia: DE
- Metro Exodus
- Metro Exodus with DXR and DLSS
- Microsoft Flight Simulator
- Red Dead Redemption 2 (Vulkan)
- Red Dead Redemption 2 (Dx12)
- Shadow of the Tomb Raider
- Shadow of the Tomb Raider with DXR
- Total War Saga: Troy
- Wasteland 3
- Overall gaming performance and performance per euro
- CompuBench (OpenCL)
- SPECviewperf 2020 and SPECworkstation 3
- FLOPS, IOPS and memory speed tests
- 3D rendering 1/2 (LuxMark and Blender@Cycles)
- 3D rendering 2/2 (Blender@Radeon ProRender and Eevee)
- Photo editing (Adobe Photoshop, Lightroom and Affinity Photo)
- Broadcasting (OBS and Xsplit)
- Password cracking
- GPU clock speeds
- GPU and VRAM temperatures
- Net GPU power draw and performance per watt
- Analysis of 12 V branch power supply (higher load)
- Analysis of 12 V branch power supply (lower load)
- Analysis of 3,3 V branch power supply
- Noise level
- Frequency response of sound
- Conclusion


The cooling is not too great. Lower models like 3070 Gaming Trio do operate silently in comparison. Maybe some blame can be attributed to high TDP. Still disappointing to see. Coil whine with 2 high peaks in the traditional frequency area is even more disappointing. MSI seemed to be the way to go for folks who want to avoid bad coil whine. Not anymore.