
Frequency response of sound
After the entry test of the Sapphire RX 6700 XT Nitro+, the second part of the series is here, tests with active Smart Access Memory. Immediately after the launch of the card, we would write about the performance that attacks the RTX 3070. In the meantime, all GeForce RTX 30 cards started to support Resizable BAR and the situation is changing a bit. ReBAR can no longer be ignored in Nvidia’s GPUs, but we don’t have to take it too seriously.
Frequency response of sound
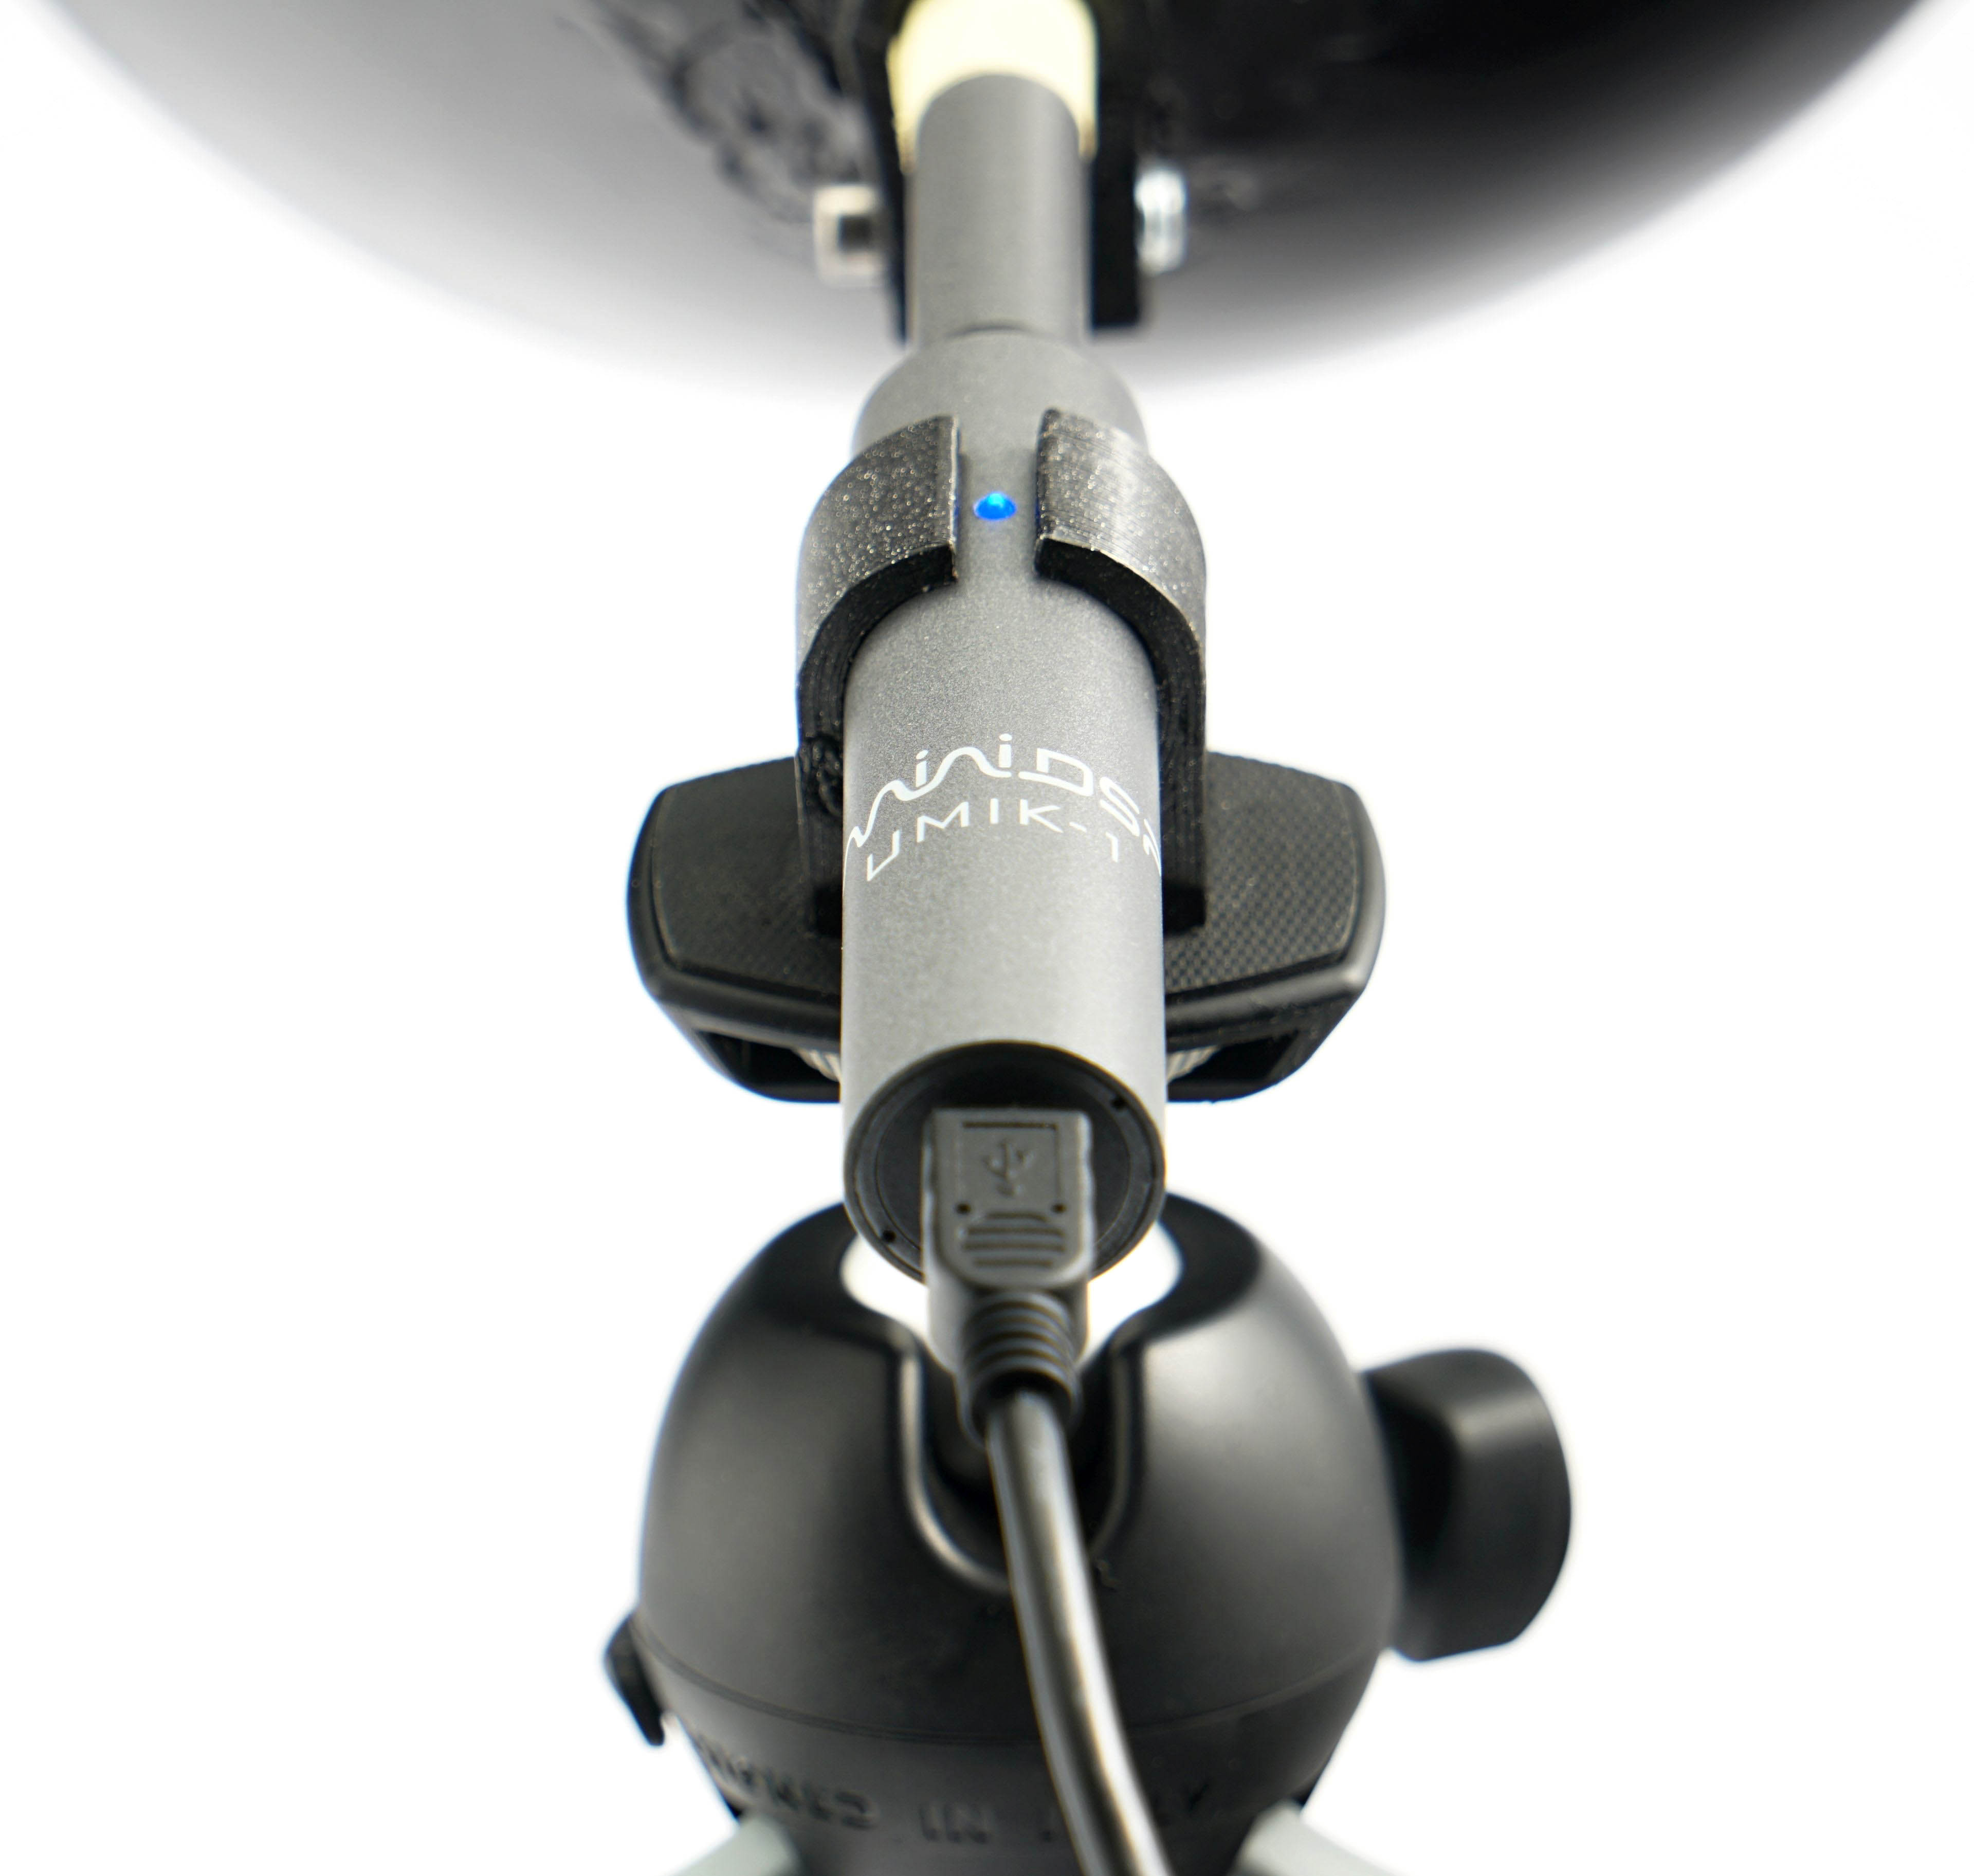
Measurements are performed in the TrueRTA application, which records sound in a range of 240 frequencies in the recorded range of 20–20,000 Hz. For the possibility of comparison across articles, we export the dominant frequency from the low (20–200 Hz), medium (201–2,000 Hz) and high (2,001–20,000 Hz) range to standard bar graphs. However, for an even more detailed analysis of the sound expression, it is important to perceive the overall shape of the graph and the intensity of all frequencies/tones.
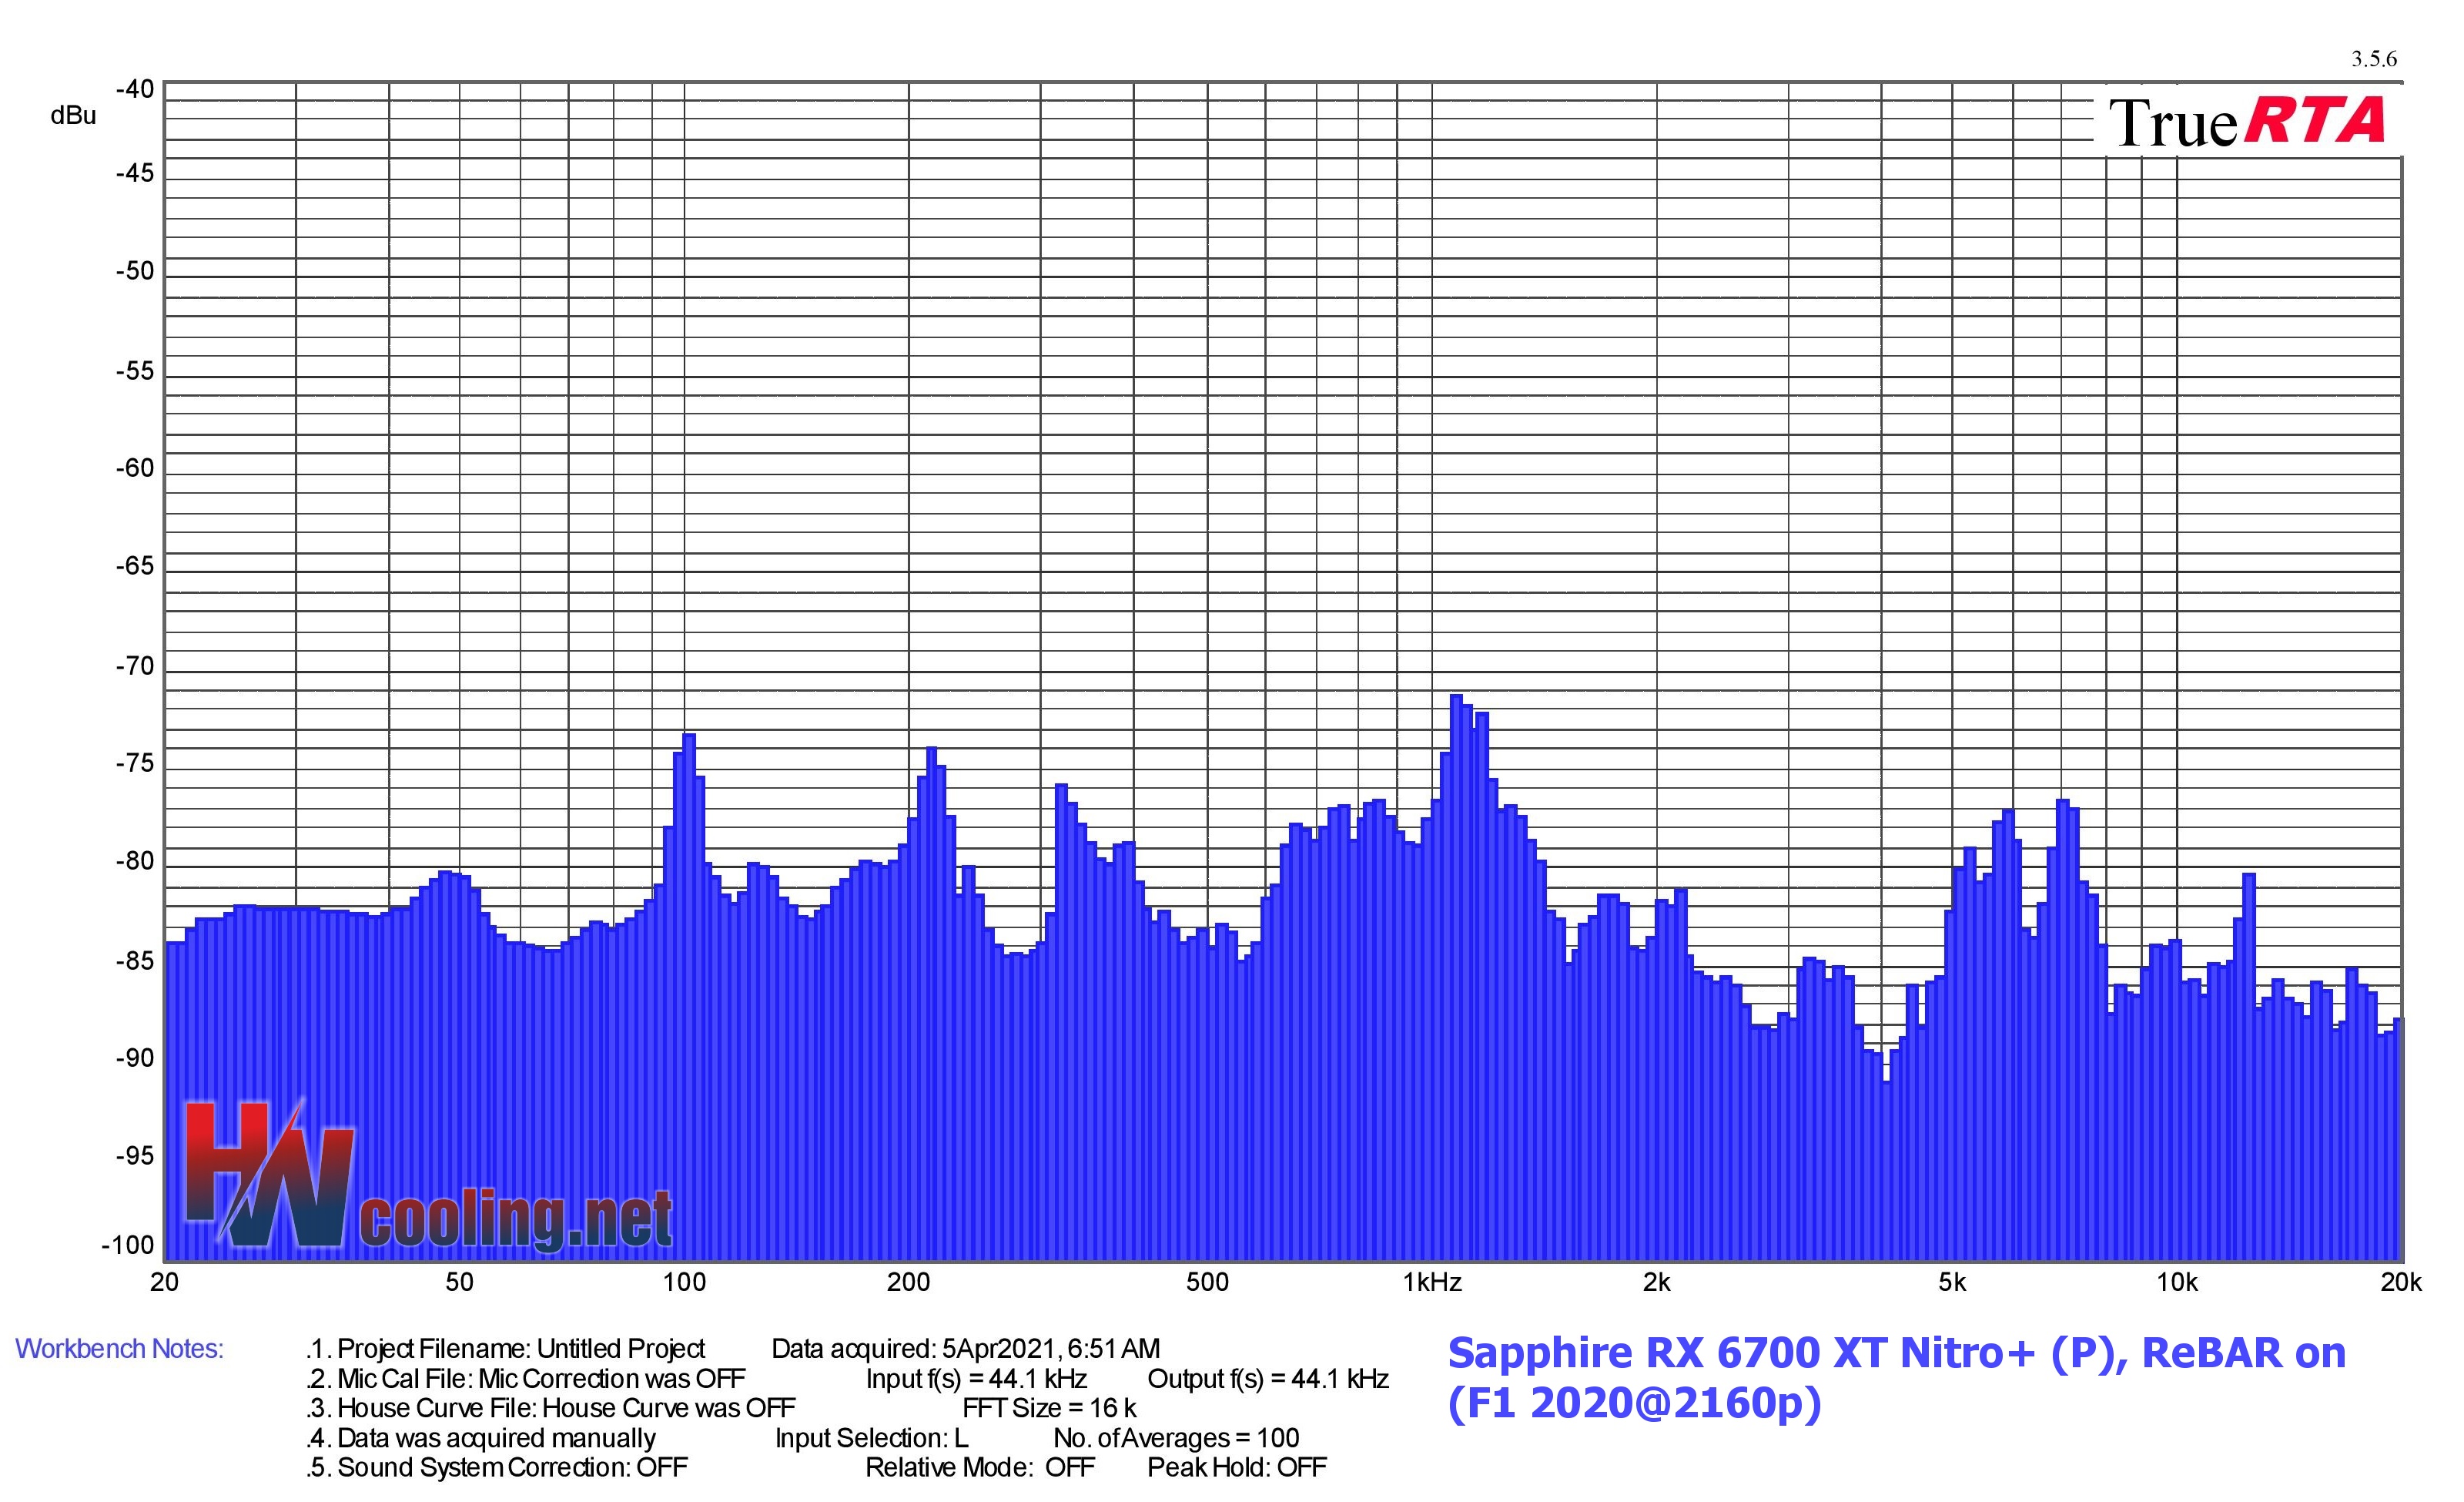
| Graphics card | Dominant sound freq. and noise level in F1 2020@2160p | NF-F12 PWM | NF-A15 PWM | ||||
| Low range | Mid range | High range | |||||
| Frequency [Hz] | Noise level [dBu] | Frequency [Hz] | Noise level [-dBu] | Frequency [Hz] | Noise level [-dBu] | ||
| Sapphire RX 6700 XT Nitro+ (P), ReBAR on | 100,794 | -73,224 | 1076,347 | -71,246 | 7034,643 | -76,524 | |
| Sapphire RX 6700 XT Nitro+ (P), ReBAR off | 100,794 | -75,199 | 1076,347 | -73,483 | 7034,643 | -76,501 | |
| MSI RTX 3060 Ti Gaming X Trio, ReBAR off | 100,794 | -70,608 | 1107,887 | -82,797 | 7034,643 | -83,730 | |
| Gigabyte RTX 3060 Eagle OC 12G, ReBAR off | 100,794 | -71,611 | 213,574 | -64,261 | 2031,873 | -74,162 | |
| MSI RTX 3090 Gaming X Trio, ReBAR off | 100,794 | -72,330 | 1076,347 | -75,992 | 4561,401 | -81,229 | |
| MSI RTX 3070 Gaming X Trio, ReBAR off | 100,794 | -73,926 | 1076,347 | -79,719 | 6267,154 | -85,076 | |
| AMD Radeon RX 6800, ReBAR on | 100,794 | -71,019 | 1076,347 | -66,494 | 9665,273 | -81,252 | |
| AMD Radeon RX 6800, ReBAR off | 100,794 | -71,759 | 1107,887 | -67,416 | 2091,412 | -75,288 | |
| TUF RTX 3080 O10G Gaming, ReBAR off | 100,794 | -76,045 | 1107,887 | -77,850 | 7034,643 | -74,423 | |
| AMD Radeon RX 6800 XT, ReBAR on | 100,794 | -71,589 | 1107,887 | -74,742 | 10848,902 | -76,306 | |
| AMD Radeon RX 6800 XT, ReBAR off | 100,794 | -72,991 | 1107,887 | -74,724 | 10848,902 | -76,519 |

| Graphics card | Dominant sound freq. and noise level in SOTTR@2160p | NF-F12 PWM | NF-A15 PWM | ||||
| Low range | Mid range | High range | |||||
| Frequency [Hz] | Noise level [dBu] | Frequency [Hz] | Noise level [-dBu] | Frequency [Hz] | Noise level [-dBu] | ||
| Sapphire RX 6700 XT Nitro+ (P), ReBAR on | 100,794 | -73,918 | 1140,350 | -75,427 | 5915,406 | -77,227 | |
| Sapphire RX 6700 XT Nitro+ (P), ReBAR off | 100,794 | -75,137 | 1107,887 | -75,221 | 5915,406 | -76,482 | |
| MSI RTX 3060 Ti Gaming X Trio, ReBAR off | 100,794 | -70,764 | 1076,347 | -83,630 | 7034,643 | -81,871 | |
| Gigabyte RTX 3060 Eagle OC 12G, ReBAR off | 100,794 | -71,937 | 213,574 | -64,455 | 2031,873 | -73,841 | |
| MSI RTX 3090 Gaming X Trio, ReBAR off | 106,787 | -74,468 | 213,574 | -71,307 | 4561,401 | -79,260 | |
| MSI RTX 3070 Gaming X Trio, ReBAR off | 100,794 | -72,952 | 213,574 | -72,275 | 6267,154 | -84,919 | |
| AMD Radeon RX 6800, ReBAR on | 100,794 | -71,769 | 1140,350 | -66,111 | 9948,487 | -81,293 | |
| AMD Radeon RX 6800, ReBAR off | 100,794 | -71,603 | 1140,350 | -67,765 | 9665,273 | -80,642 | |
| TUF RTX 3080 O10G Gaming, ReBAR off | 100,794 | -75,410 | 1076,347 | -72,321 | 7240,773 | -74,199 | |
| AMD Radeon RX 6800 XT, ReBAR on | 100,794 | -73,222 | 1107,887 | -73,892 | 10848,902 | -76,328 | |
| AMD Radeon RX 6800 XT, ReBAR off | 100,794 | -73,170 | 1107,887 | -75,262 | 10848,902 | -75,397 |
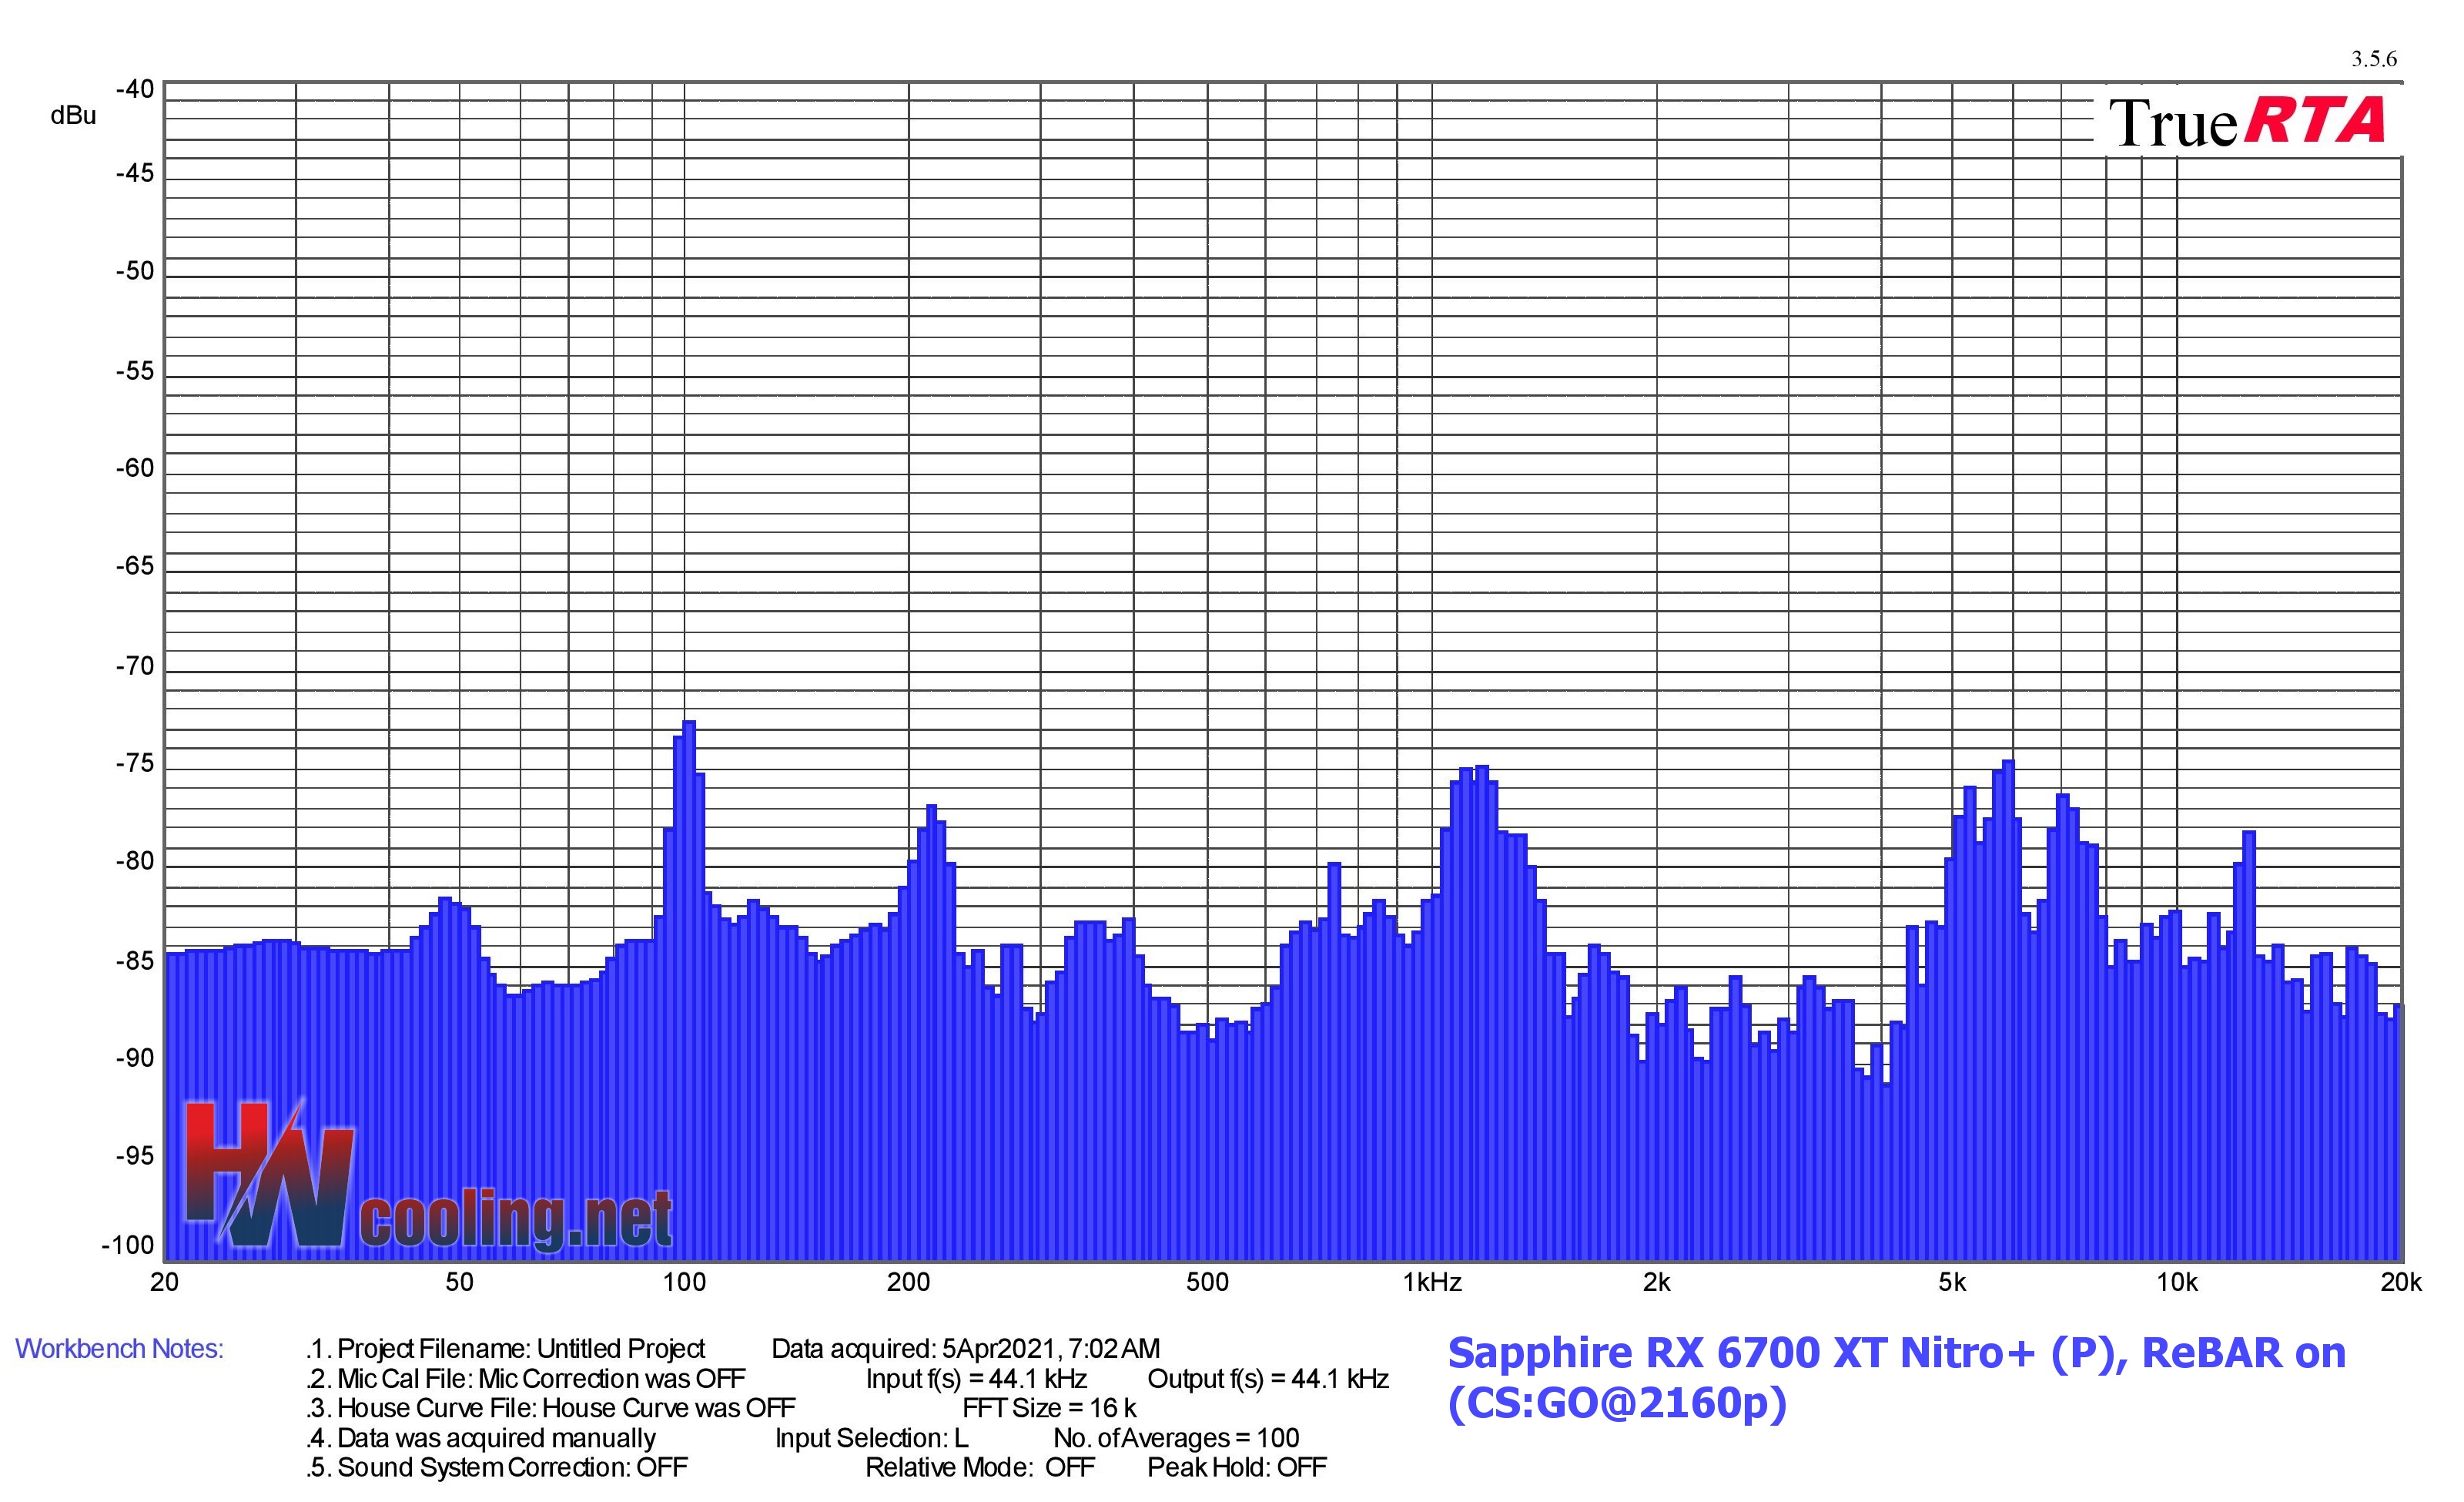
| Graphics card | Dominant sound freq. and noise level in CS:GO@2160p | NF-F12 PWM | NF-A15 PWM | ||||
| Low range | Mid range | High range | |||||
| Frequency [Hz] | Noise level [dBu] | Frequency [Hz] | Noise level [-dBu] | Frequency [Hz] | Noise level [-dBu] | ||
| Sapphire RX 6700 XT Nitro+ (P), ReBAR on | 100,794 | -72,597 | 1173,765 | -74,862 | 5915,406 | -74,613 | |
| Sapphire RX 6700 XT Nitro+ (P), ReBAR off | 100,794 | -75,012 | 1107,887 | -73,798 | 5747,006 | -74,232 | |
| MSI RTX 3060 Ti Gaming X Trio, ReBAR off | 100,794 | -71,442 | 1107,887 | -83,097 | 6267,154 | -82,469 | |
| Gigabyte RTX 3060 Eagle OC 12G, ReBAR off | 100,794 | -72,601 | 213,574 | -64,794 | 2031,873 | -73,810 | |
| MSI RTX 3090 Gaming X Trio, ReBAR off | 106,787 | -75,721 | 213,574 | -73,423 | 4695,061 | -77,625 | |
| MSI RTX 3070 Gaming X Trio, ReBAR off | 106,787 | -75,721 | 213,574 | -73,423 | 6267,154 | -82,711 | |
| AMD Radeon RX 6800, ReBAR on | 100,794 | -71,162 | 1107,887 | -66,232 | 9948,487 | -77,428 | |
| AMD Radeon RX 6800, ReBAR off | 100,794 | -71,103 | 1076,347 | -77,328 | 9665,273 | -77,714 | |
| TUF RTX 3080 O10G Gaming, ReBAR off | 100,794 | -74,208 | 1076,347 | -70,919 | 7240,773 | -74,402 | |
| AMD Radeon RX 6800 XT, ReBAR on | 100,794 | -72,999 | 1107,887 | -74,302 | 7671,332 | -72,419 | |
| AMD Radeon RX 6800 XT, ReBAR off | 100,794 | -72,346 | 1107,887 | -73,732 | 10848,902 | -72,534 |
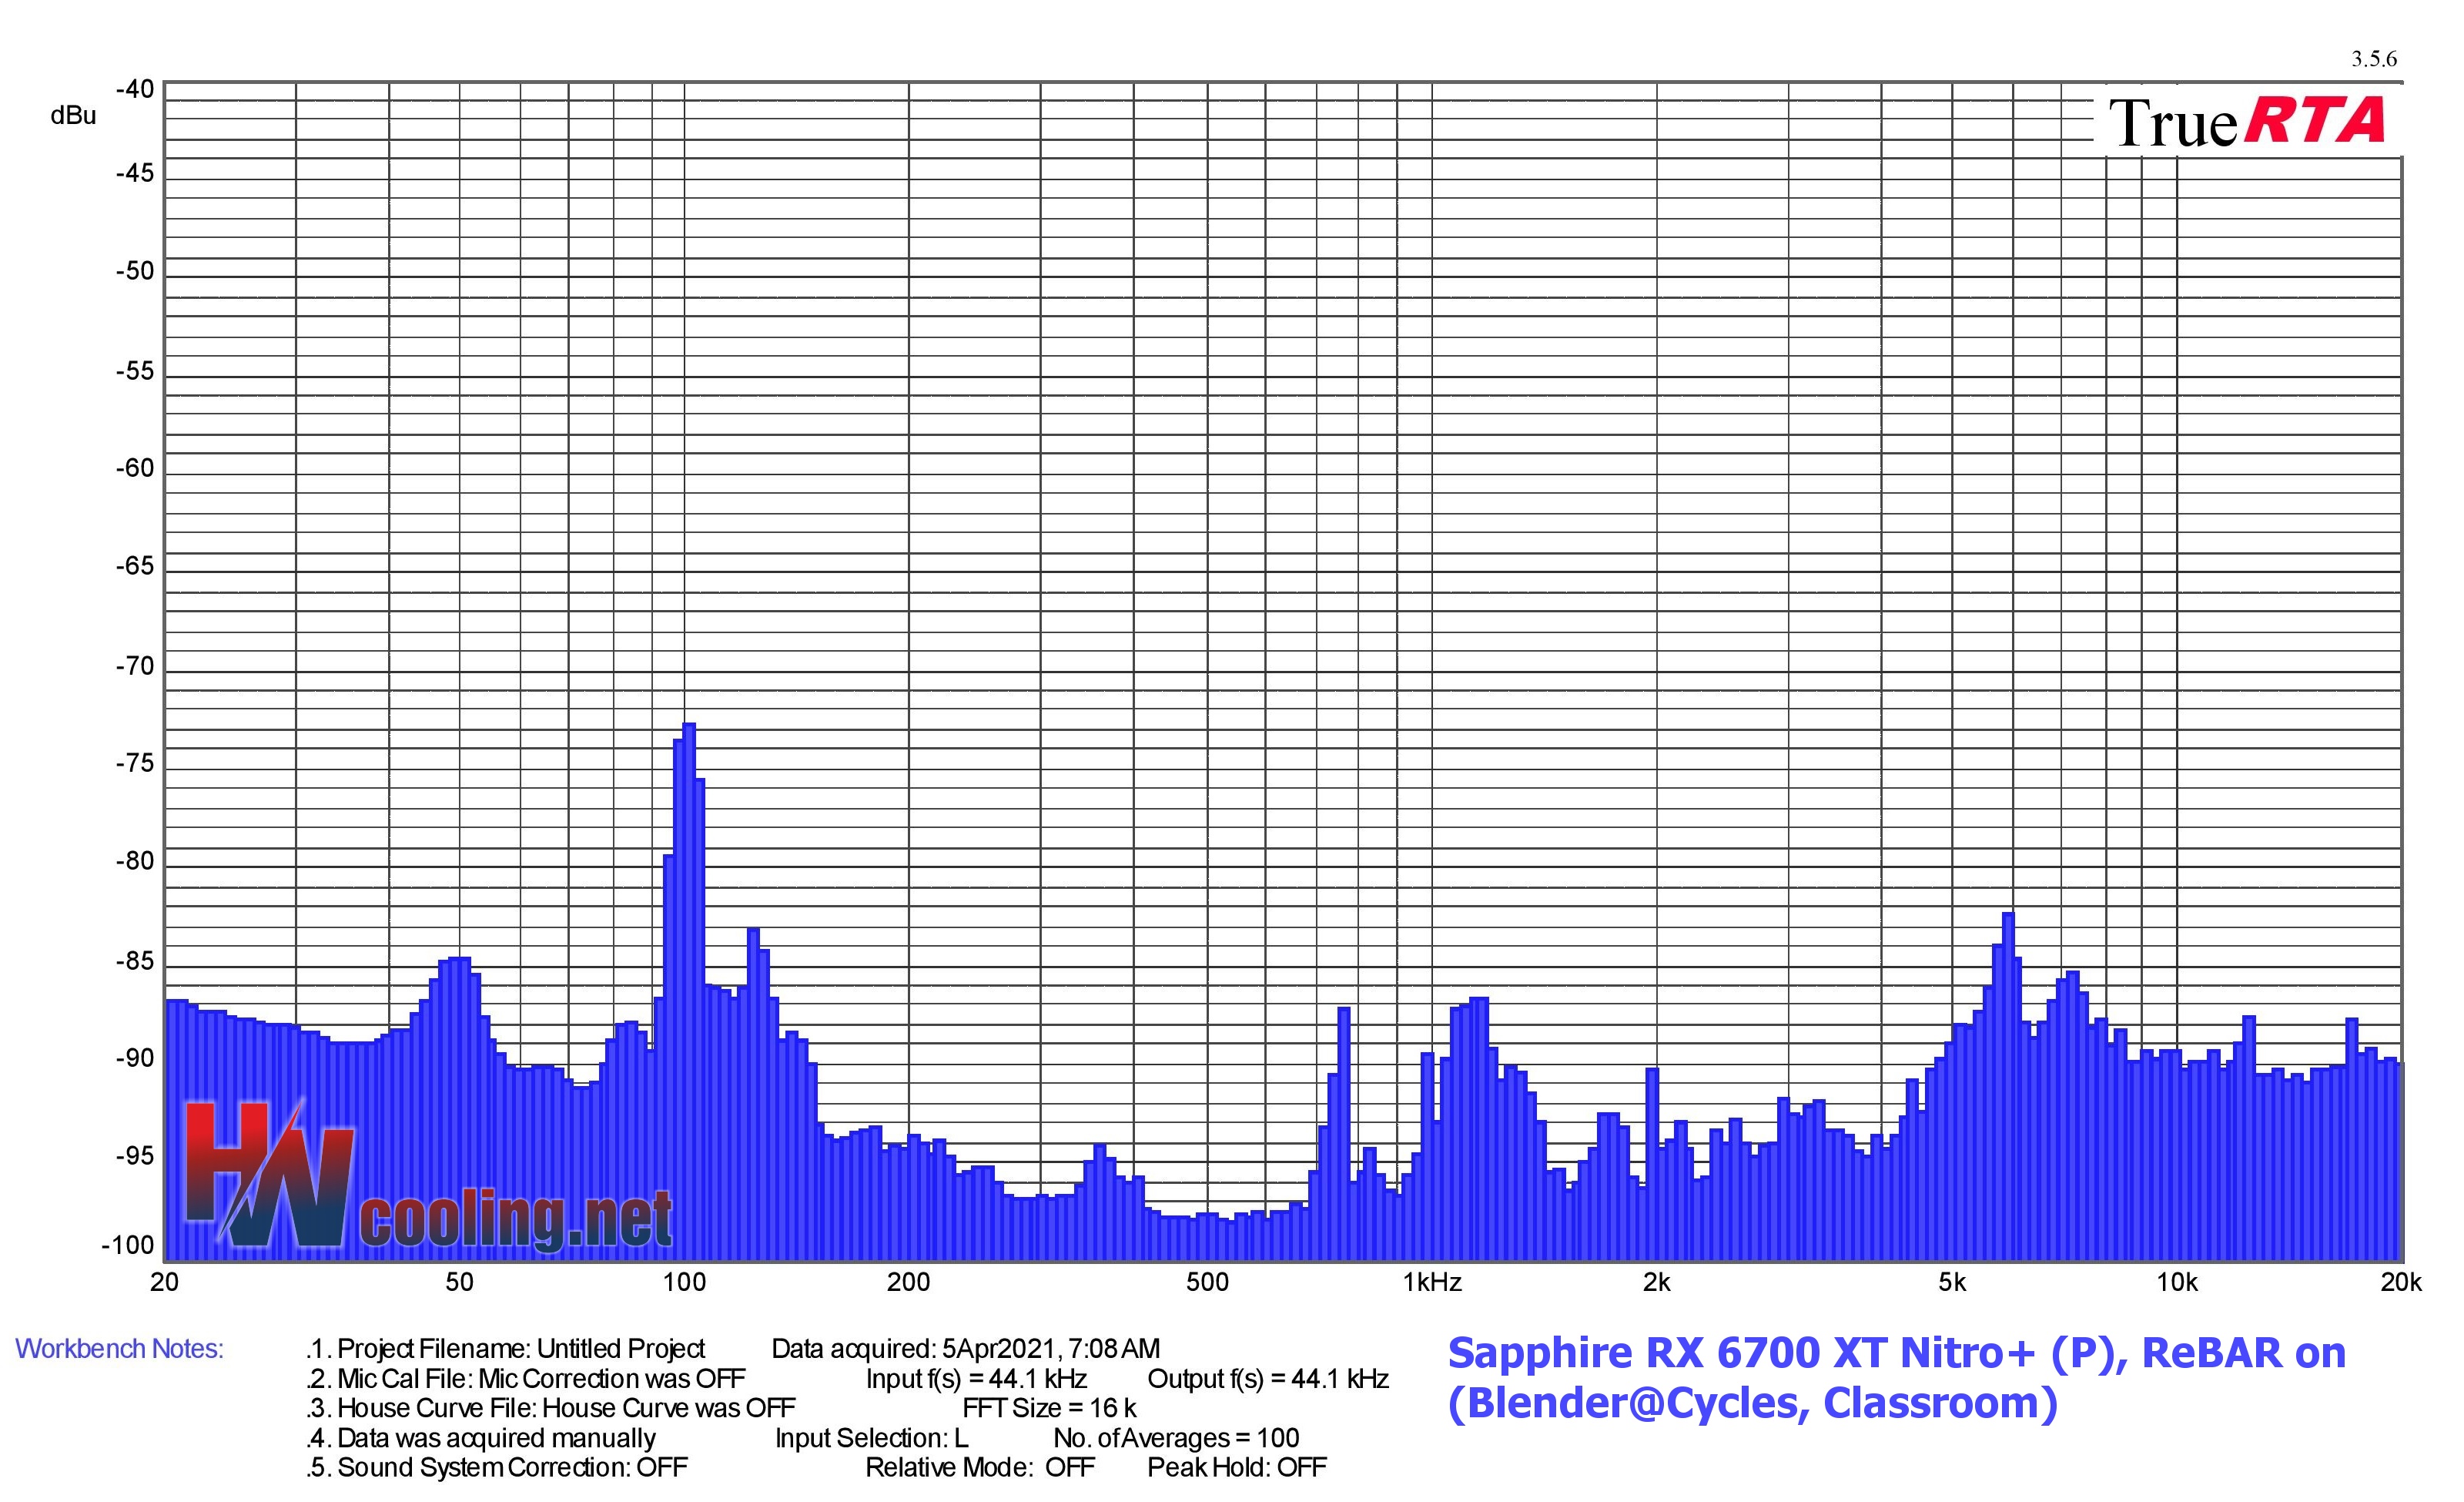
| Graphics card | Dominant sound freq. and noise level in Blender (Cycles), Classroom | NF-F12 PWM | NF-A15 PWM | ||||
| Low range | Mid range | High range | |||||
| Frequency [Hz] | Noise level [dBu] | Frequency [Hz] | Noise level [-dBu] | Frequency [Hz] | Noise level [-dBu] | ||
| Sapphire RX 6700 XT Nitro+ (P), ReBAR on | 100,794 | -72,645 | 1173,765 | -86,606 | 5915,406 | -82,388 | |
| Sapphire RX 6700 XT Nitro+ (P), ReBAR off | 100,794 | -75,786 | 1076,347 | -87,229 | 5915,406 | -82,066 | |
| MSI RTX 3060 Ti Gaming X Trio, ReBAR off | 100,794 | -70,442 | 987,015 | -89,548 | 6450,796 | -88,958 | |
| Gigabyte RTX 3060 Eagle OC 12G, ReBAR off | 100,794 | -72,605 | 213,574 | -70,007 | 2031,873 | -79,089 | |
| MSI RTX 3090 Gaming X Trio, ReBAR off | 100,794 | -71,224 | 1076,347 | -85,314 | 5915,406 | -91,953 | |
| MSI RTX 3070 Gaming X Trio, ReBAR off | 100,794 | -71,224 | 1076,347 | -85,314 | 18245,606 | -90,785 | |
| AMD Radeon RX 6800, ReBAR on | 100,794 | -71,913 | 987,015 | -89,190 | 7452,944 | -88,332 | |
| AMD Radeon RX 6800, ReBAR off | 100,794 | -71,136 | 987,015 | -89,041 | 7452,944 | -88,237 | |
| TUF RTX 3080 O10G Gaming, ReBAR off | 106,787 | -81,541 | 1659,995 | -80,568 | 6834,380 | -77,967 | |
| AMD Radeon RX 6800 XT, ReBAR on | 97,924 | -79,763 | 1208,159 | -89,625 | 7671,332 | -85,188 | |
| AMD Radeon RX 6800 XT, ReBAR off | 100,794 | -72,980 | 1243,561 | -95,235 | 7671,332 | -84,980 |
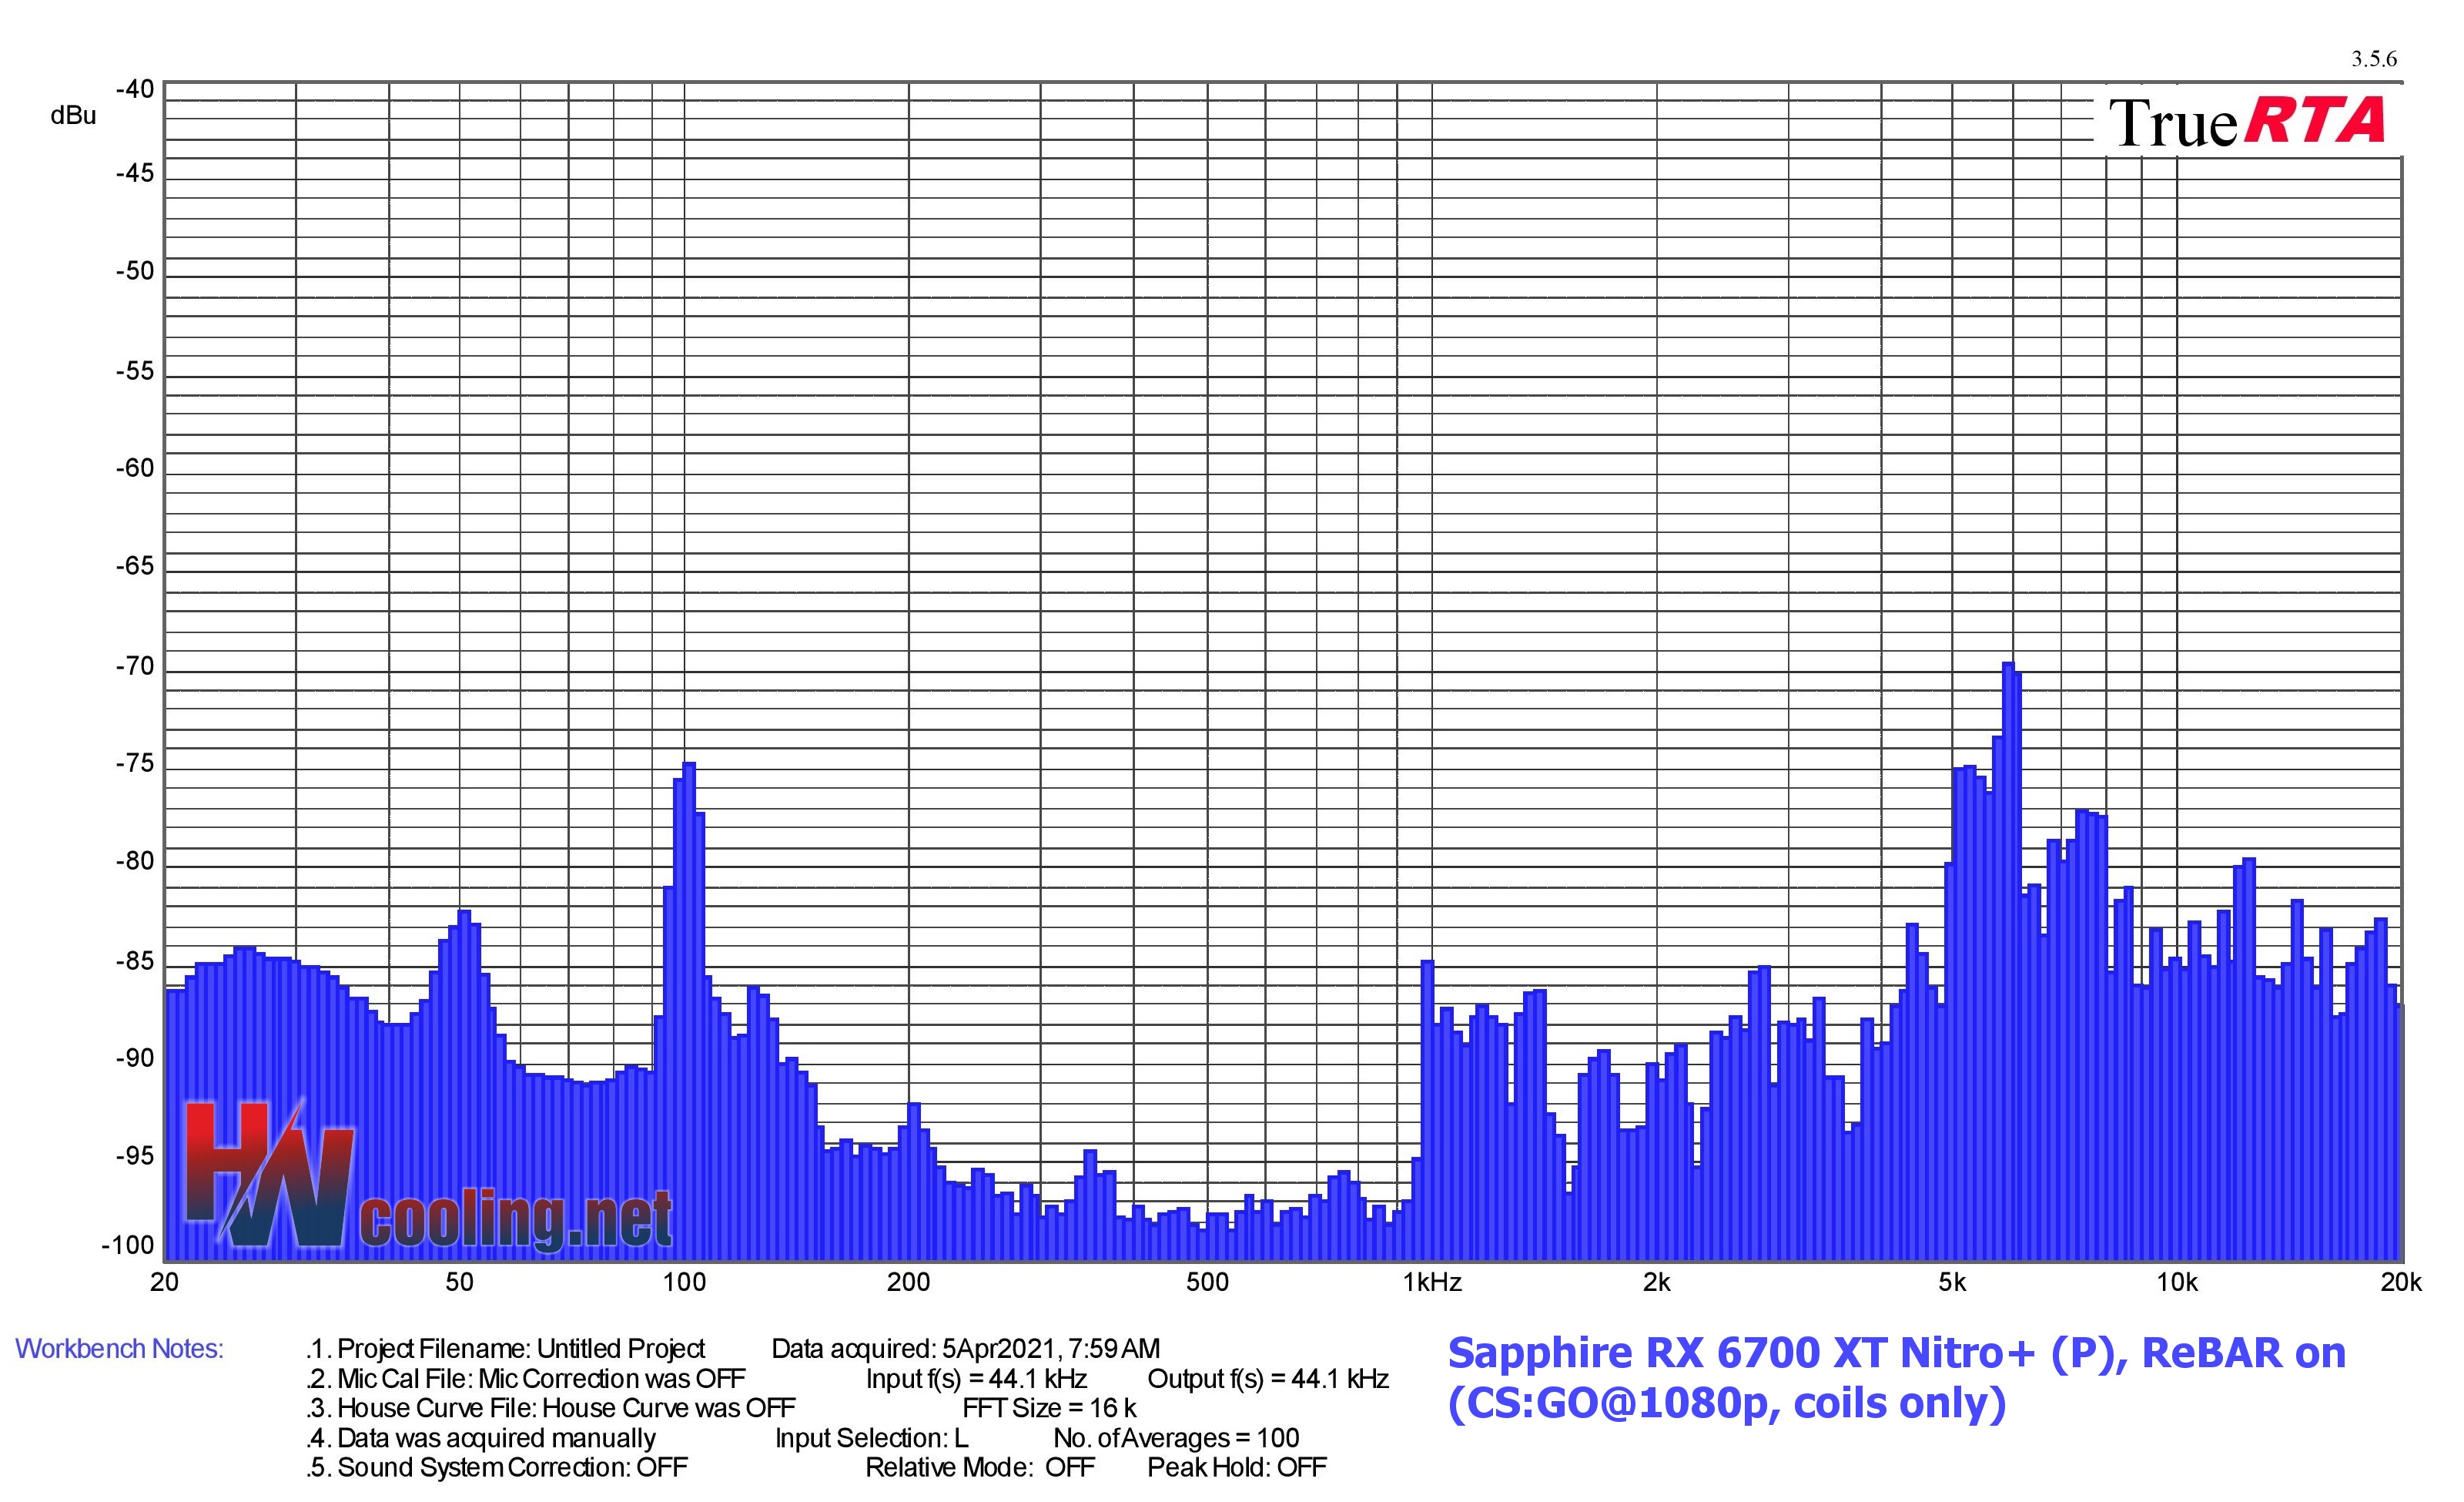
| Graphics card | Dominant sound freq. and noise level in CS:GO@1080p (coils only) | NF-F12 PWM | NF-A15 PWM | ||||
| Low range | Mid range | High range | |||||
| Frequency [Hz] | Noise level [dBu] | Frequency [Hz] | Noise level [-dBu] | Frequency [Hz] | Noise level [-dBu] | ||
| Sapphire RX 6700 XT Nitro+ (P), ReBAR on | 100,794 | -74,648 | 987,015 | -84,777 | 5747,006 | -69,614 | |
| Sapphire RX 6700 XT Nitro+ (P), ReBAR off | 100,794 | -74,670 | 1395,850 | -88,408 | 5747,006 | -70,289 | |
| MSI RTX 3060 Ti Gaming X Trio, ReBAR off | 100,794 | -73,006 | 2152,695 | -86,379 | 6267,154 | -83,576 | |
| Gigabyte RTX 3060 Eagle OC 12G, ReBAR off | 100,794 | -73,575 | 1974,030 | -90,249 | 6088,740 | -83,145 | |
| MSI RTX 3090 Gaming X Trio, ReBAR off | 50,397 | -76,126 | 987,015 | -84,836 | 5915,406 | -83,323 | |
| MSI RTX 3070 Gaming X Trio, ReBAR off | 100,794 | -74,662 | 1317,507 | -81,448 | 6088,740 | -84,631 | |
| AMD Radeon RX 6800, ReBAR on | 100,794 | -71,813 | 987,015 | -87,658 | 7452,944 | -80,420 | |
| AMD Radeon RX 6800, ReBAR off | 100,794 | -72,013 | 1659,955 | -90,354 | 8863,094 | -84,530 | |
| TUF RTX 3080 O10G Gaming, ReBAR off | 100,794 | -75,576 | 1140,350 | -81,739 | 9948,487 | -78,734 | |
| AMD Radeon RX 6800 XT, ReBAR on | 100,794 | -73,593 | 1659,955 | -79,766 | 7452,944 | -73,997 | |
| AMD Radeon RX 6800 XT, ReBAR off | 100,794 | -73,272 | 1659,955 | -83,327 | 7452,944 | -76,372 |
- Contents
- Methodology: performance tests
- Methodology: how we measure power draw
- Methodology: noise and sound measurement
- Methodology: temperature tests
- Test rig
- 3DMark
- Age of Empires II: DE
- Assassin’s Creed: Valhalla
- Battlefield V
- Battlefield V with DXR
- Borderlands 3
- Control
- Control with DXR
- Counter-Strike: GO
- Cyberpunk 2077
- Cyberpunk 2077 with FidelityFX CAS
- Cyberpunk 2077 with DXR
- DOOM Eternal
- F1 2020
- FIFA 21
- Forza Horizon 4
- Mafia: DE
- Metro Exodus
- Metro Exodus with DXR
- Microsoft Flight Simulator
- Red Dead Redemption 2 (Vulkan)
- Red Dead Redemption 2 (Dx12)
- Shadow of the Tomb Raider
- Shadow of the Tomb Raider with DXR
- Total War Saga: Troy
- Wasteland 3
- Overall game performance and performance per euro
- CompuBench (OpenCL)
- SPECviewperf 2020 and SPECworkstation 3
- FLOPS, IOPS and memory speed tests
- 3D rendering 1/2 (LuxMark and Blender@Cycles)
- 3D rendering 2/2 (Blender@Radeon ProRender and Eevee)
- Photo editing (Adobe Photoshop, Lightroom and Affinity Photo)
- Broadcasting (OBS and Xsplit)
- Password cracking
- GPU clock speed
- GPU temperatures
- Net graphics power draw and performance per watt
- Analysis of 12 V subcircuit power supply (higher load)
- Analysis of 12 V subcircuit power supply (lower load)
- Analysis of 3.3 V subcircuit power supply
- Noise level
- Frequency response of sound
- Conclusion