
Test methodology
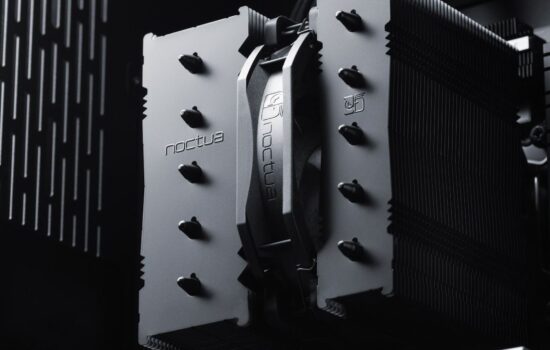
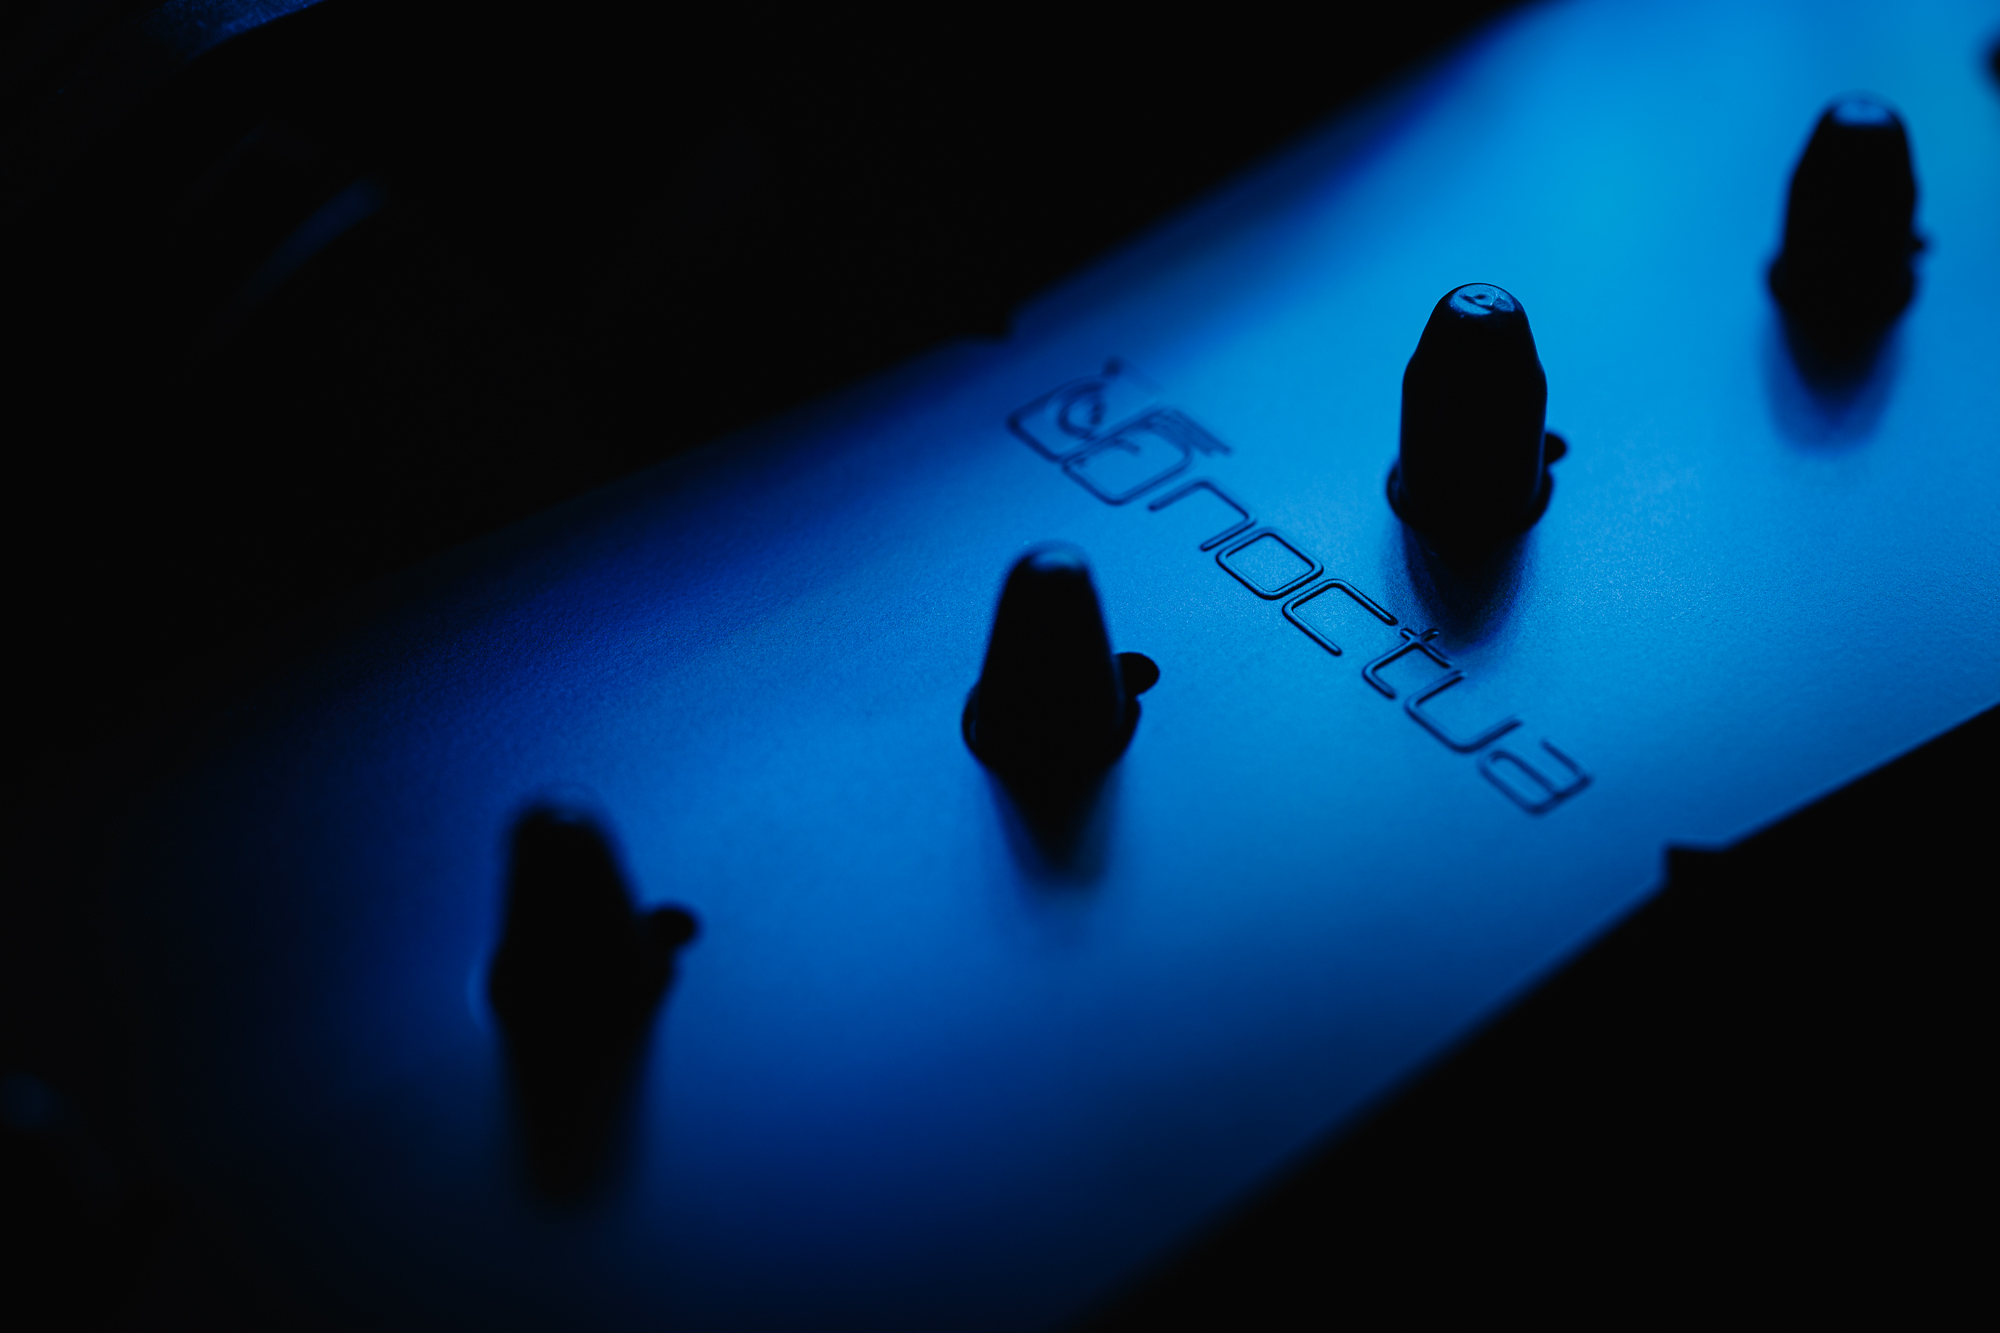
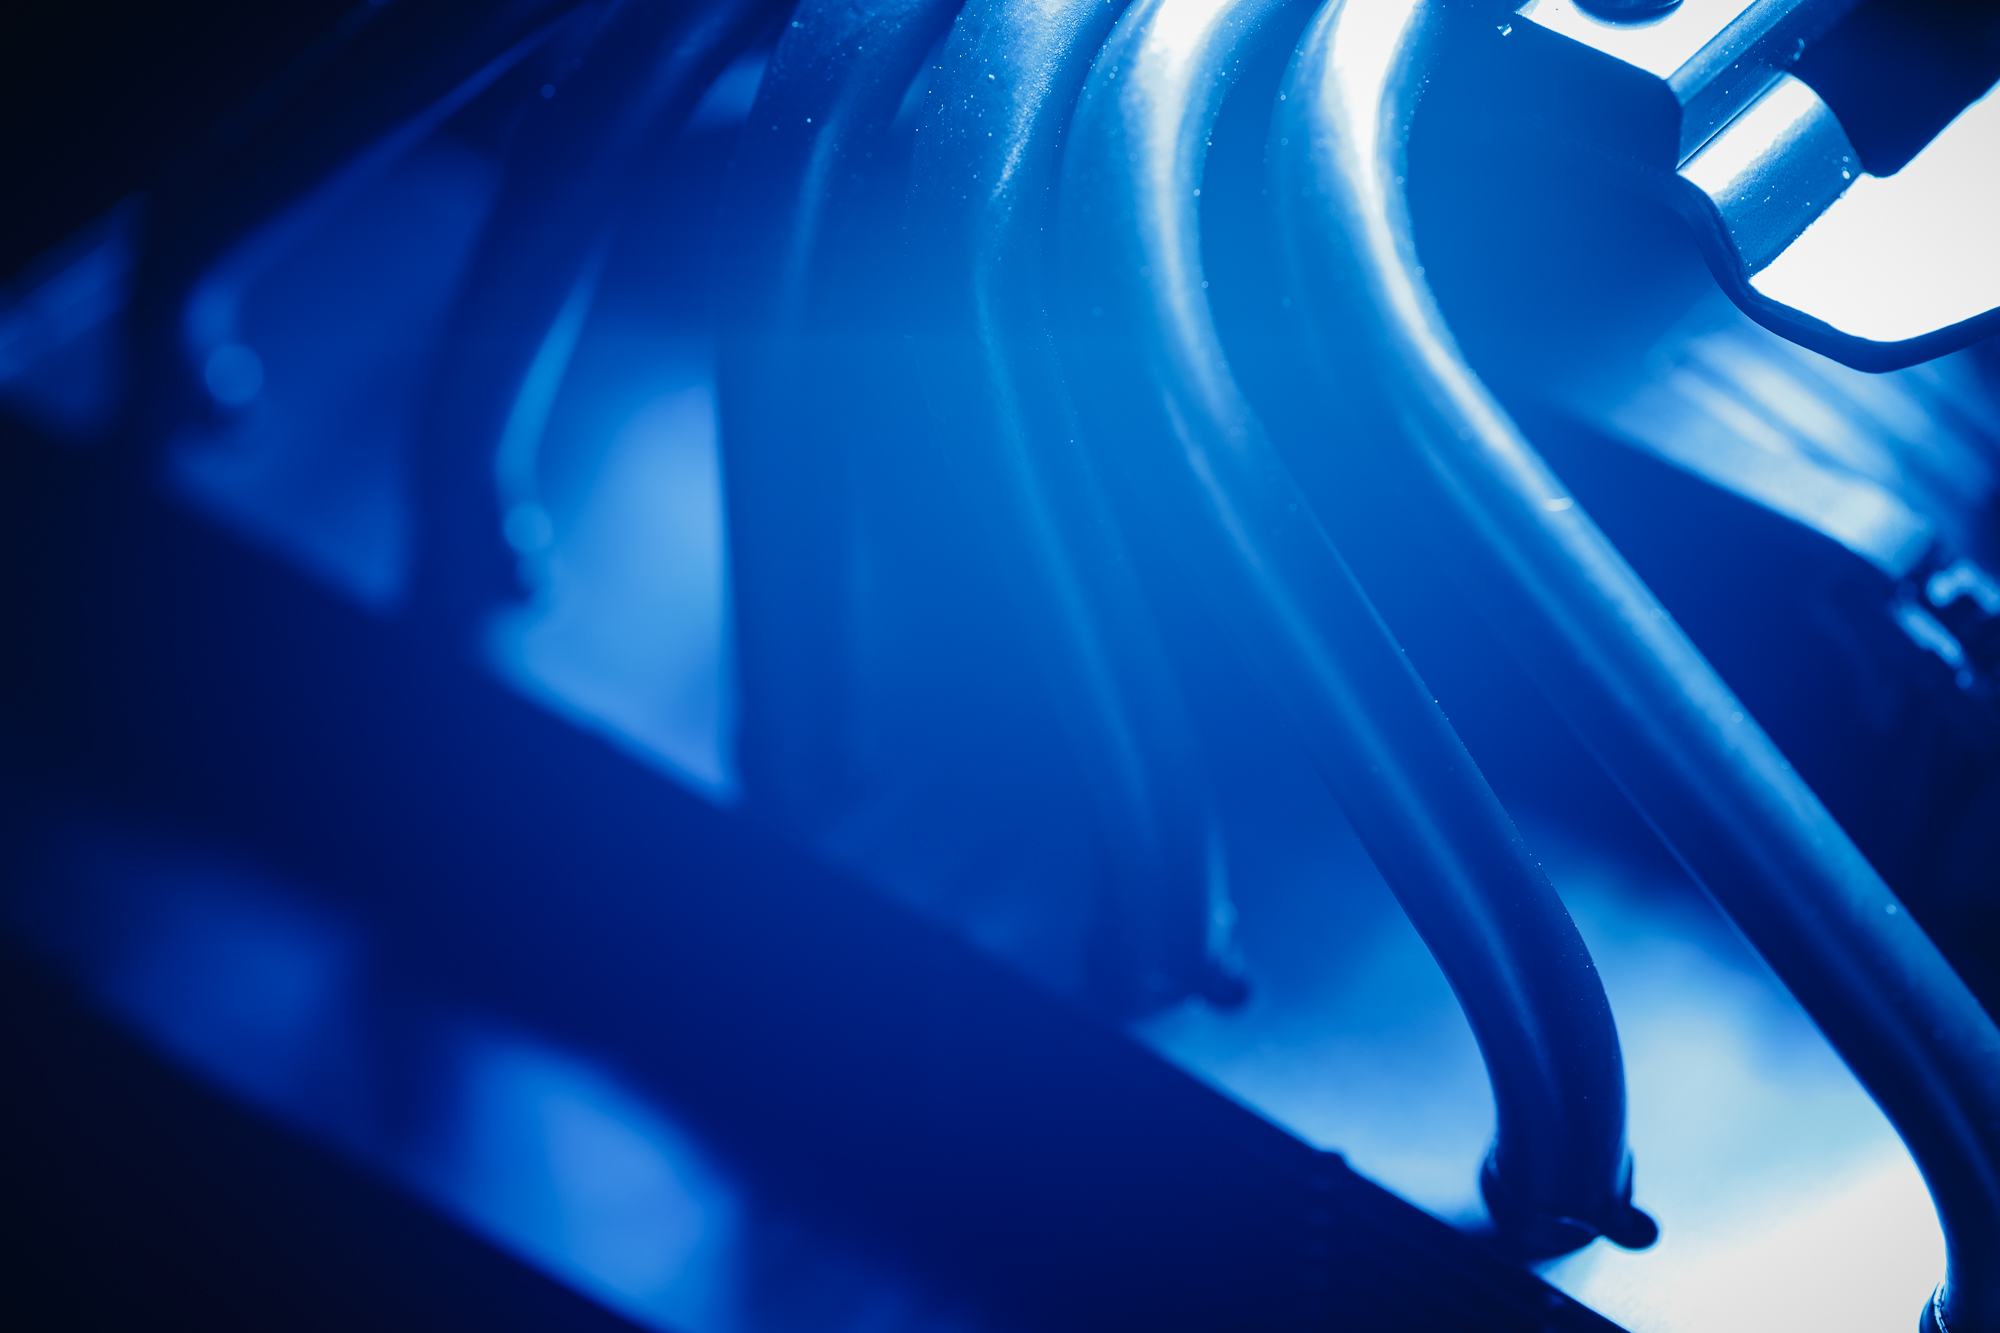
Noctua NH-D15S has been at the forefront of coolers for many years. However, the typically beige color of Noctua fans is usually not very popular. But a new version of this cooler with the chromax.black attribute has recently been released. This version has a black finish from the fan to the last screw. In addition, it should not affect the efficiency of the heatsink, but all that remains is to verify it on a hot processor.
Test methodology
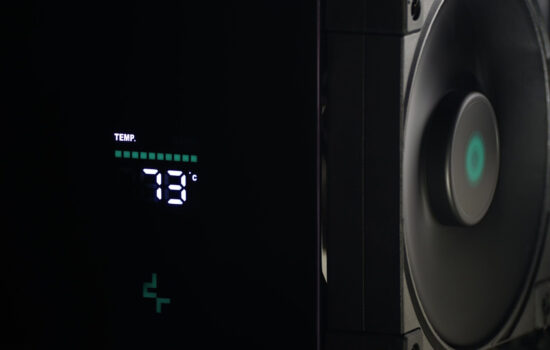
The Intel Core i7-5820K in the ASRock X99 Taichi motherboard serves as a heat generator. The whole rig is placed on a Streacom BC1 benchtable without fans that would provide airflow. Stress tests are performed using the Aida64 Extreme application with a duration of 45–60 minutes. The coolers are tested at three speed levels (800, 1200 and maximum) at a processor clock speed of 4200 MHz with a voltage of 1.150 V. This is followed by another series of tests at 4500 MHz with a voltage of 1.350 V. The processor power draw at these clock speeds is approx. 150 W and 200 W, respectively.
The second series of tests represents a heavy load for most coolers. Thus, not all tested coolers can be expected to be able to cool the processor at all speed levels. The noise is measured using a calibrated Voltcraft SL-100 sound level meter in quick measurement mode (125 ms) with a sensitivity range of 30–100 dBA at a distance of 50 cm from the cooler. Measurements take place at three fan speed levels: 800, 1200 and maximum.
At the end of the test, the highest temperature reached is always recorded. All data regarding temperatures and power draw of the processor are obtained from the HWiNFO64 application. The results are then corrected for ambient temperature as the final Delta T value. The test success limit is set at 80 °C. Any higher value means the processor temperature above 100 °C and a risk of thermal throttling. Therefore, if the cooler does not pass the stress test with a Delta T value below 80 °C, such test is marked as failed.
Due to the fact that the layout of the room where I perform the tests changed slightly, I preferred to retest most of the coolers that got into my hands. Fortunately, the deviations were mostly minimal, but I wanted to make sure that the consistency of the tests was maintained. Just so you shouldn’t be surprised that the graphs from older articles now have slightly different values. Unfortunately, a few coolers have dropped out of the database, but I will try to include them again. And due to the fact that our database of coolers is slowly growing, we will now divide the results into three sections according to RPM for better clarity.
- Contents
- Key features
- Test methodology
- Results – max rpm
- Results – medium rpm
- Results – low rpm
- Conclusion and summary