


It has exactly the elements that make an inexpensive fan aerodynamically efficient and acoustically unobtrusive. Or rather, not too obtrusive—at least at lower, non‑high speeds. At higher speeds, every fan is “noisy,” but making a low‑cost fan that can still be described as pleasant to the ear is already something of a feat. We can, however, state that ID‑Cooling has achieved this with the AM‑120‑K model.
33 dBA or 33 dBA
The noise level, given as a single dBA value, is good for quick reference, but it doesn’t give you an idea of exactly what the sound sounds like. That’s because it averages a mix of noise levels of all frequencies of sound. One fan may disturb you more than the other, even though they both reach exactly the same dBA, yet each is characterized by different dominant (louder) frequencies. To analyze thoroughly with an idea of the “color” of the sound, it is essential to record and assess noise levels across the entire spectrum of frequencies that we perceive.

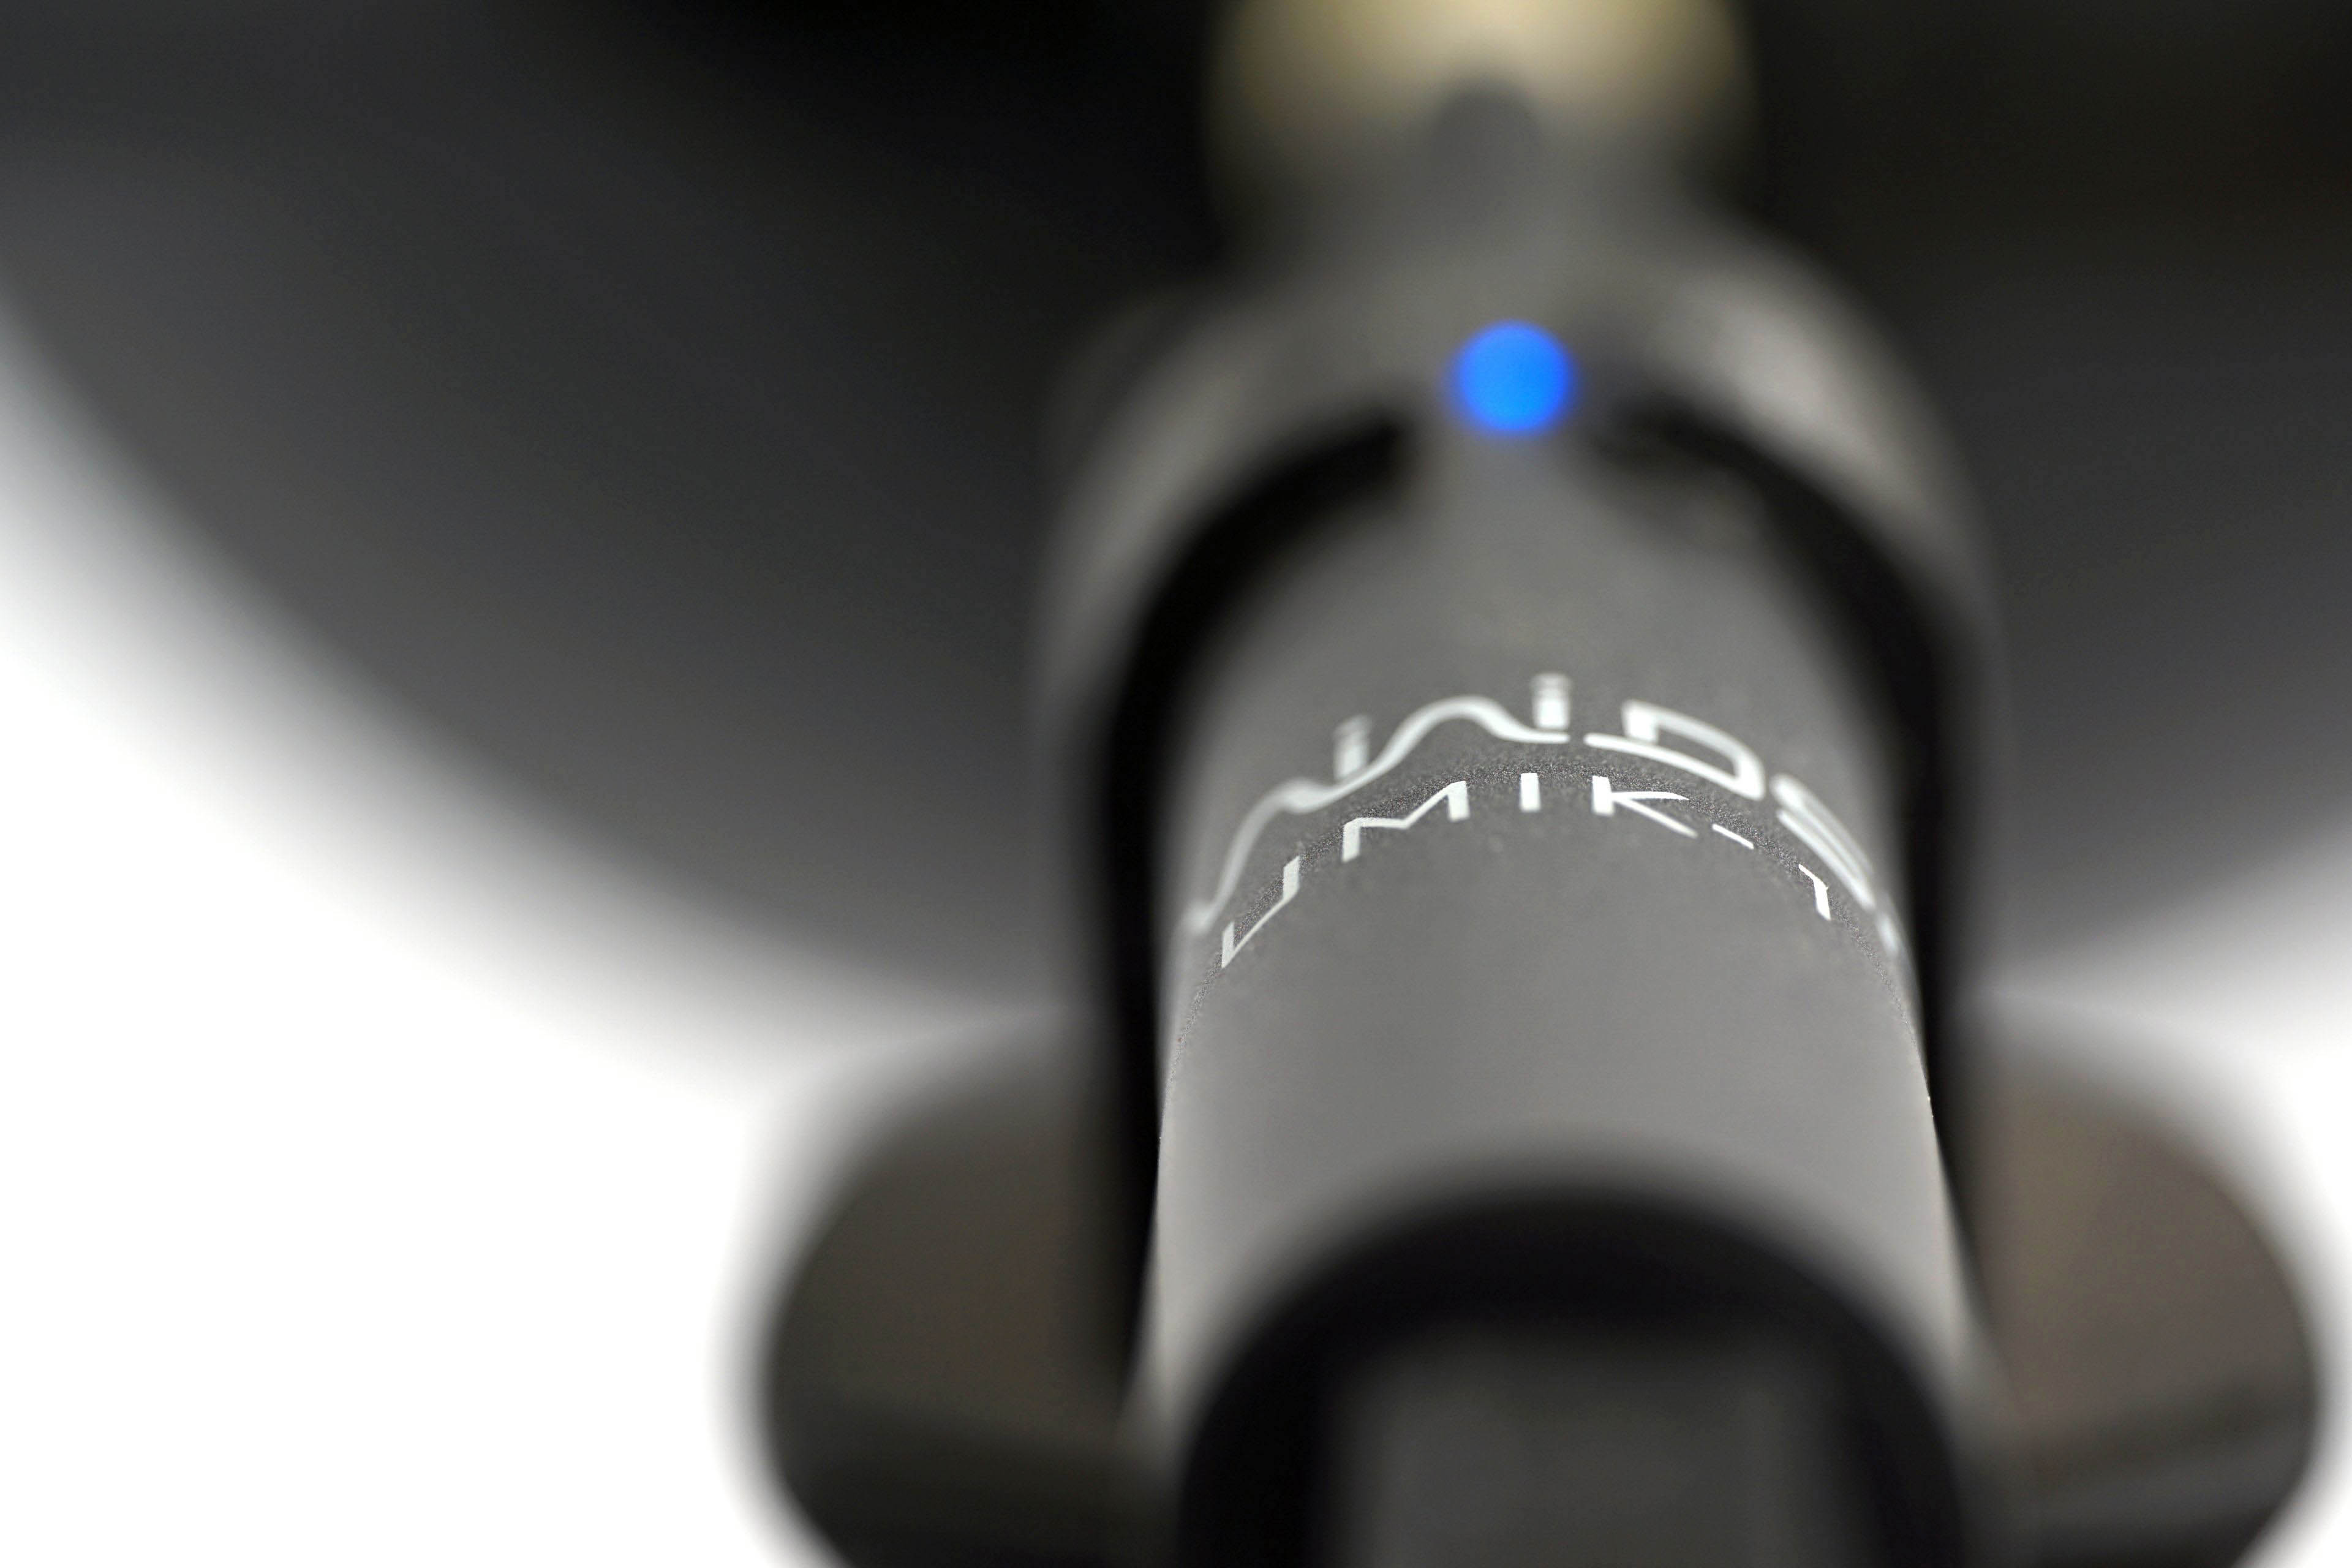
We already do this in graphics card tests, and we’ll do it for fans too, where it makes even more sense. Using the UMIK-1 miniDSP microphone and TrueRTA’s mode-specific, fixed dBA application, we also measure which frequencies contribute more and which contribute less to the sound. The monitored frequency range is 20-20,000 Hz, which we’ll work with at a fine resolution of 1/24 octave. In it, noise levels from 20 Hz to 20 000 Hz are captured at up to 240 frequencies.
The information captured in the spectrograph is a bit more than we will need for clear fan comparisons. While you’ll always find a complete spectrograph in the tests, we’ll only work with the dominant frequencies (and their noise intensities) in the low, mid, and high bands in the comparison tables and charts. The low frequency band is represented by 20–200 Hz, the medium by 201–2000 Hz and the high by 2001–20 000 Hz. From each of these three bands, we select the dominant frequency, i.e. the loudest one, which contributes most to the composition of the sound.
To the dominant frequency we also give the intensity of its noise. However, in this case it is in a different decibel scale than those you are used to from noise meter measurements. Instead of dBA, we have dBu. This is a finer scale, which is additionally expressed negatively. Be careful of this when studying the results—a noise intensity of -70 dBu is higher than -75 dBu. We discussed this in more detail in the article Get familiar with measuring the frequency response of sound.
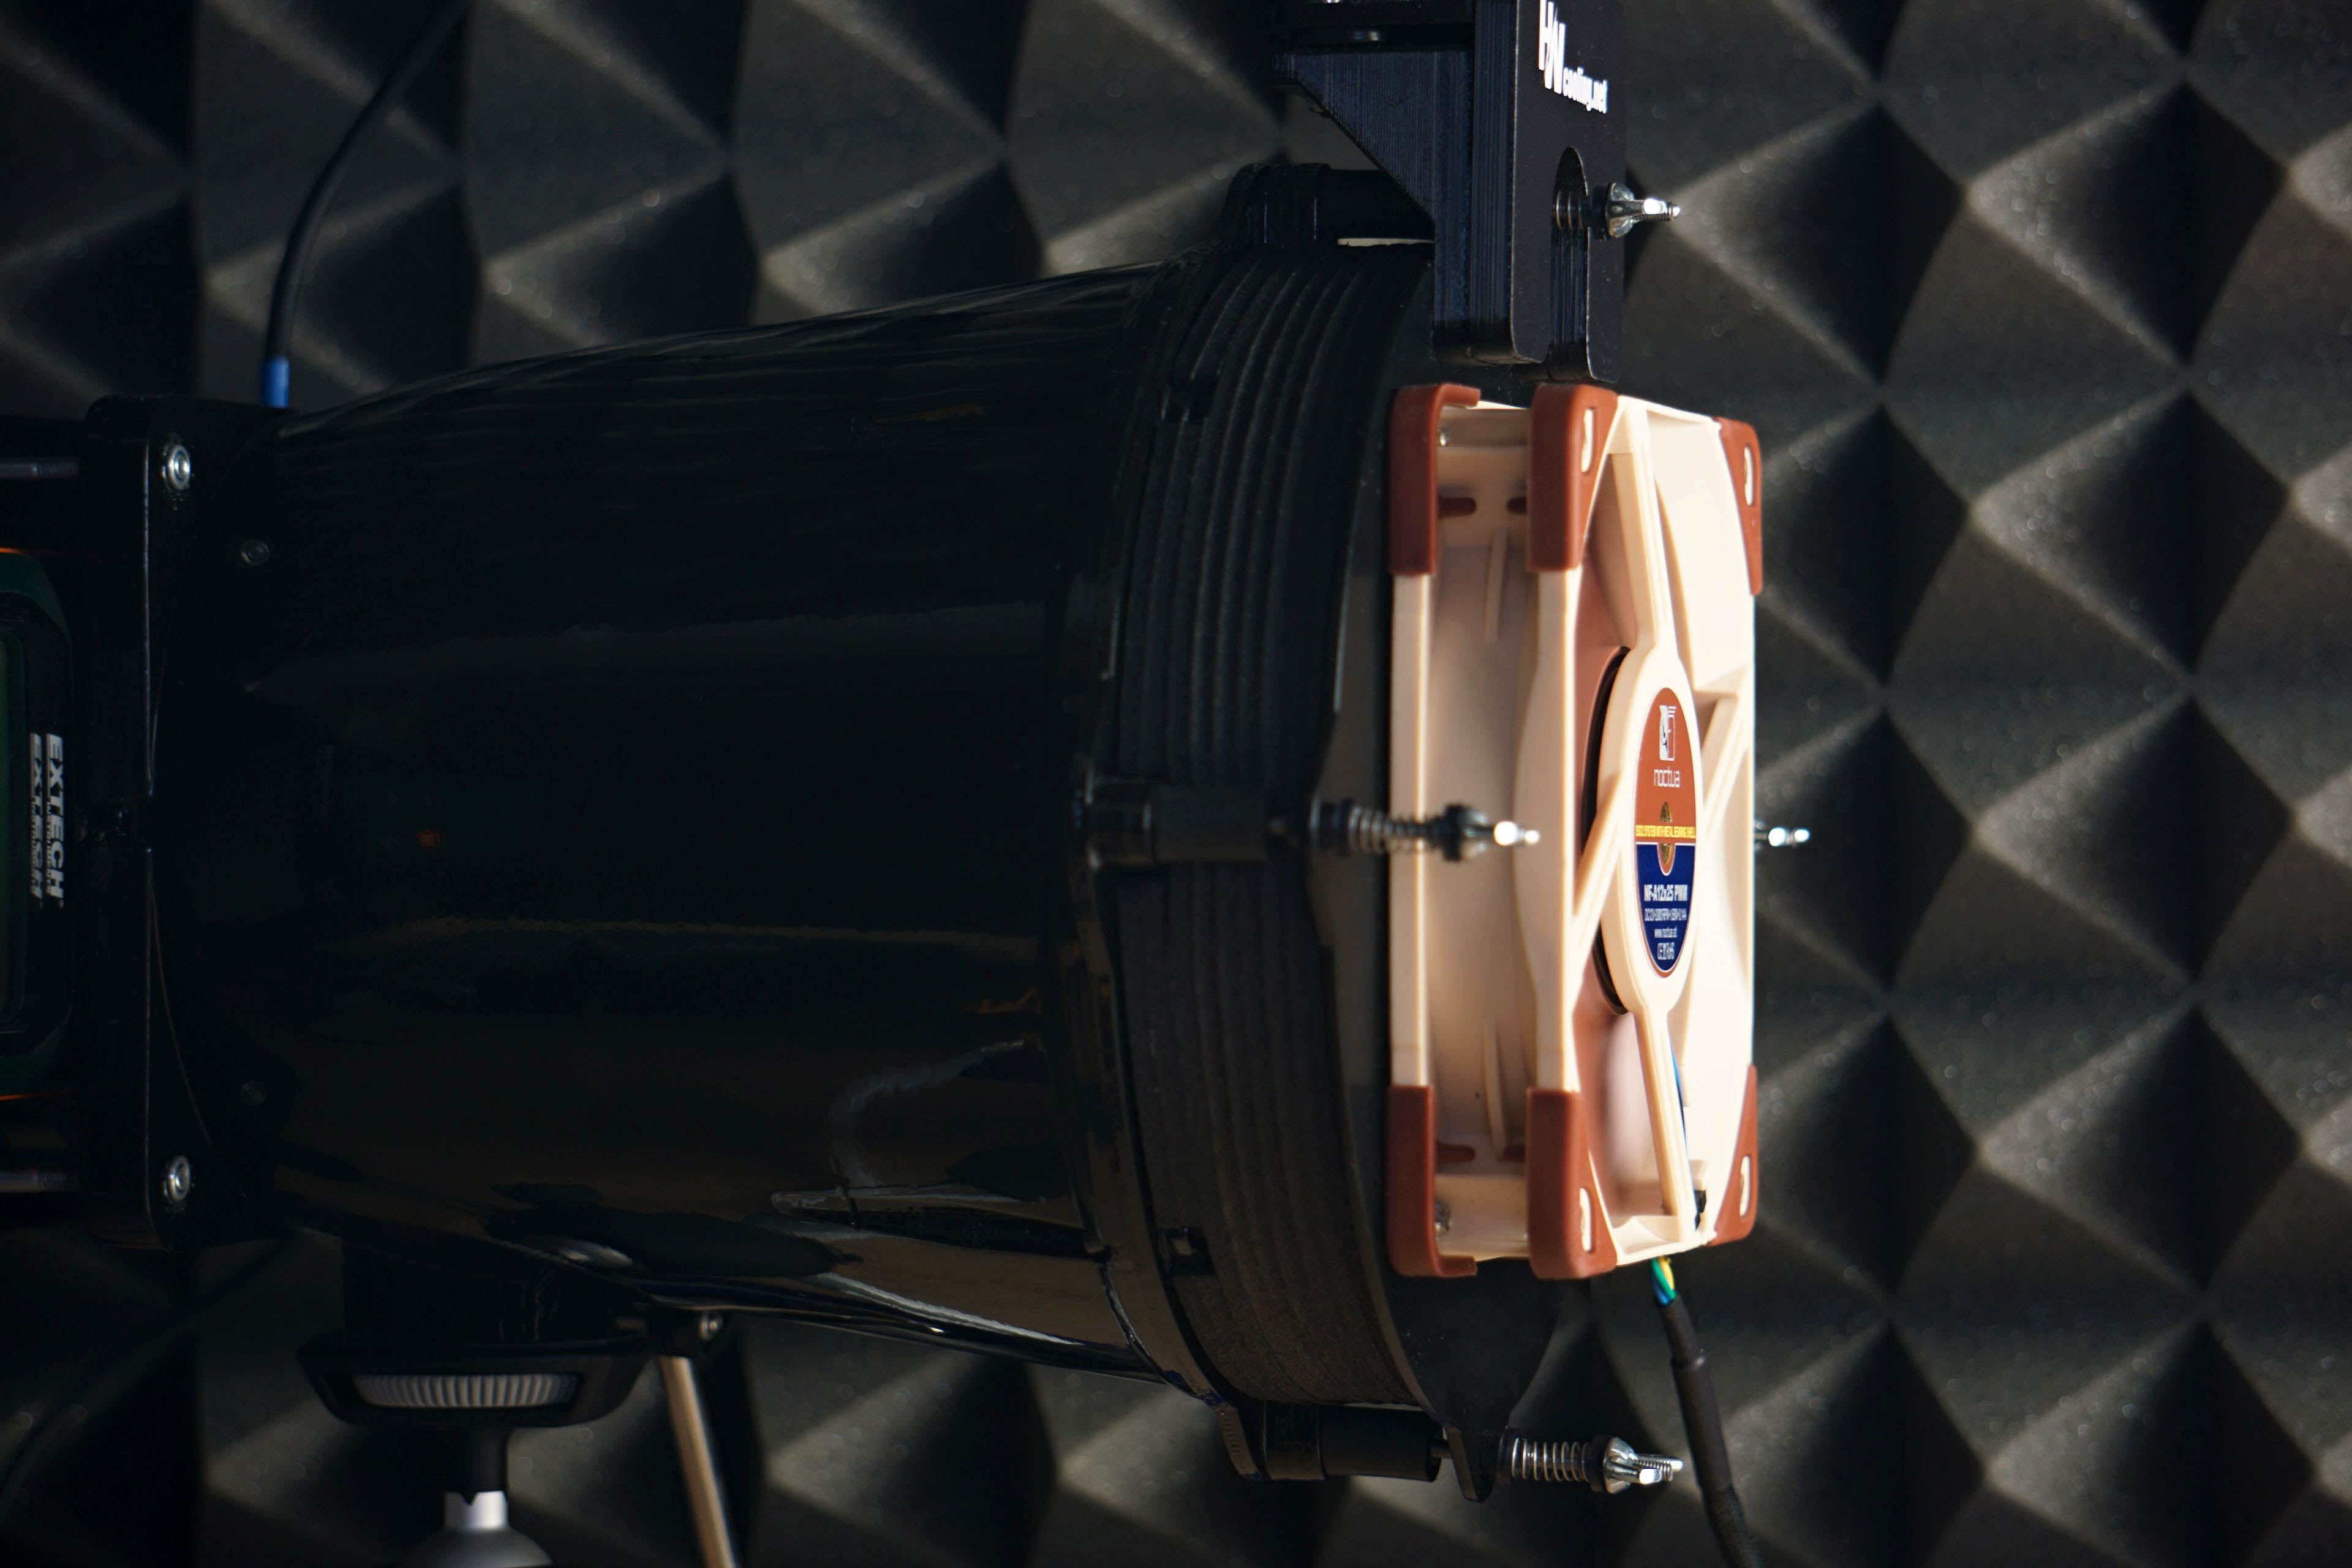
Strict acoustic safeguards are required to ensure that these measurements can be carried out with satisfactory repeatability at all. We use acoustic panels to measure the same values at all frequencies across repeated measurements. These ensure that the sound is always reflected equally to the microphone regardless of the distribution of other objects we have in the testlab. The baseline noise level before each measurement is also naturally the same. The room in which we measure is soundproofed.
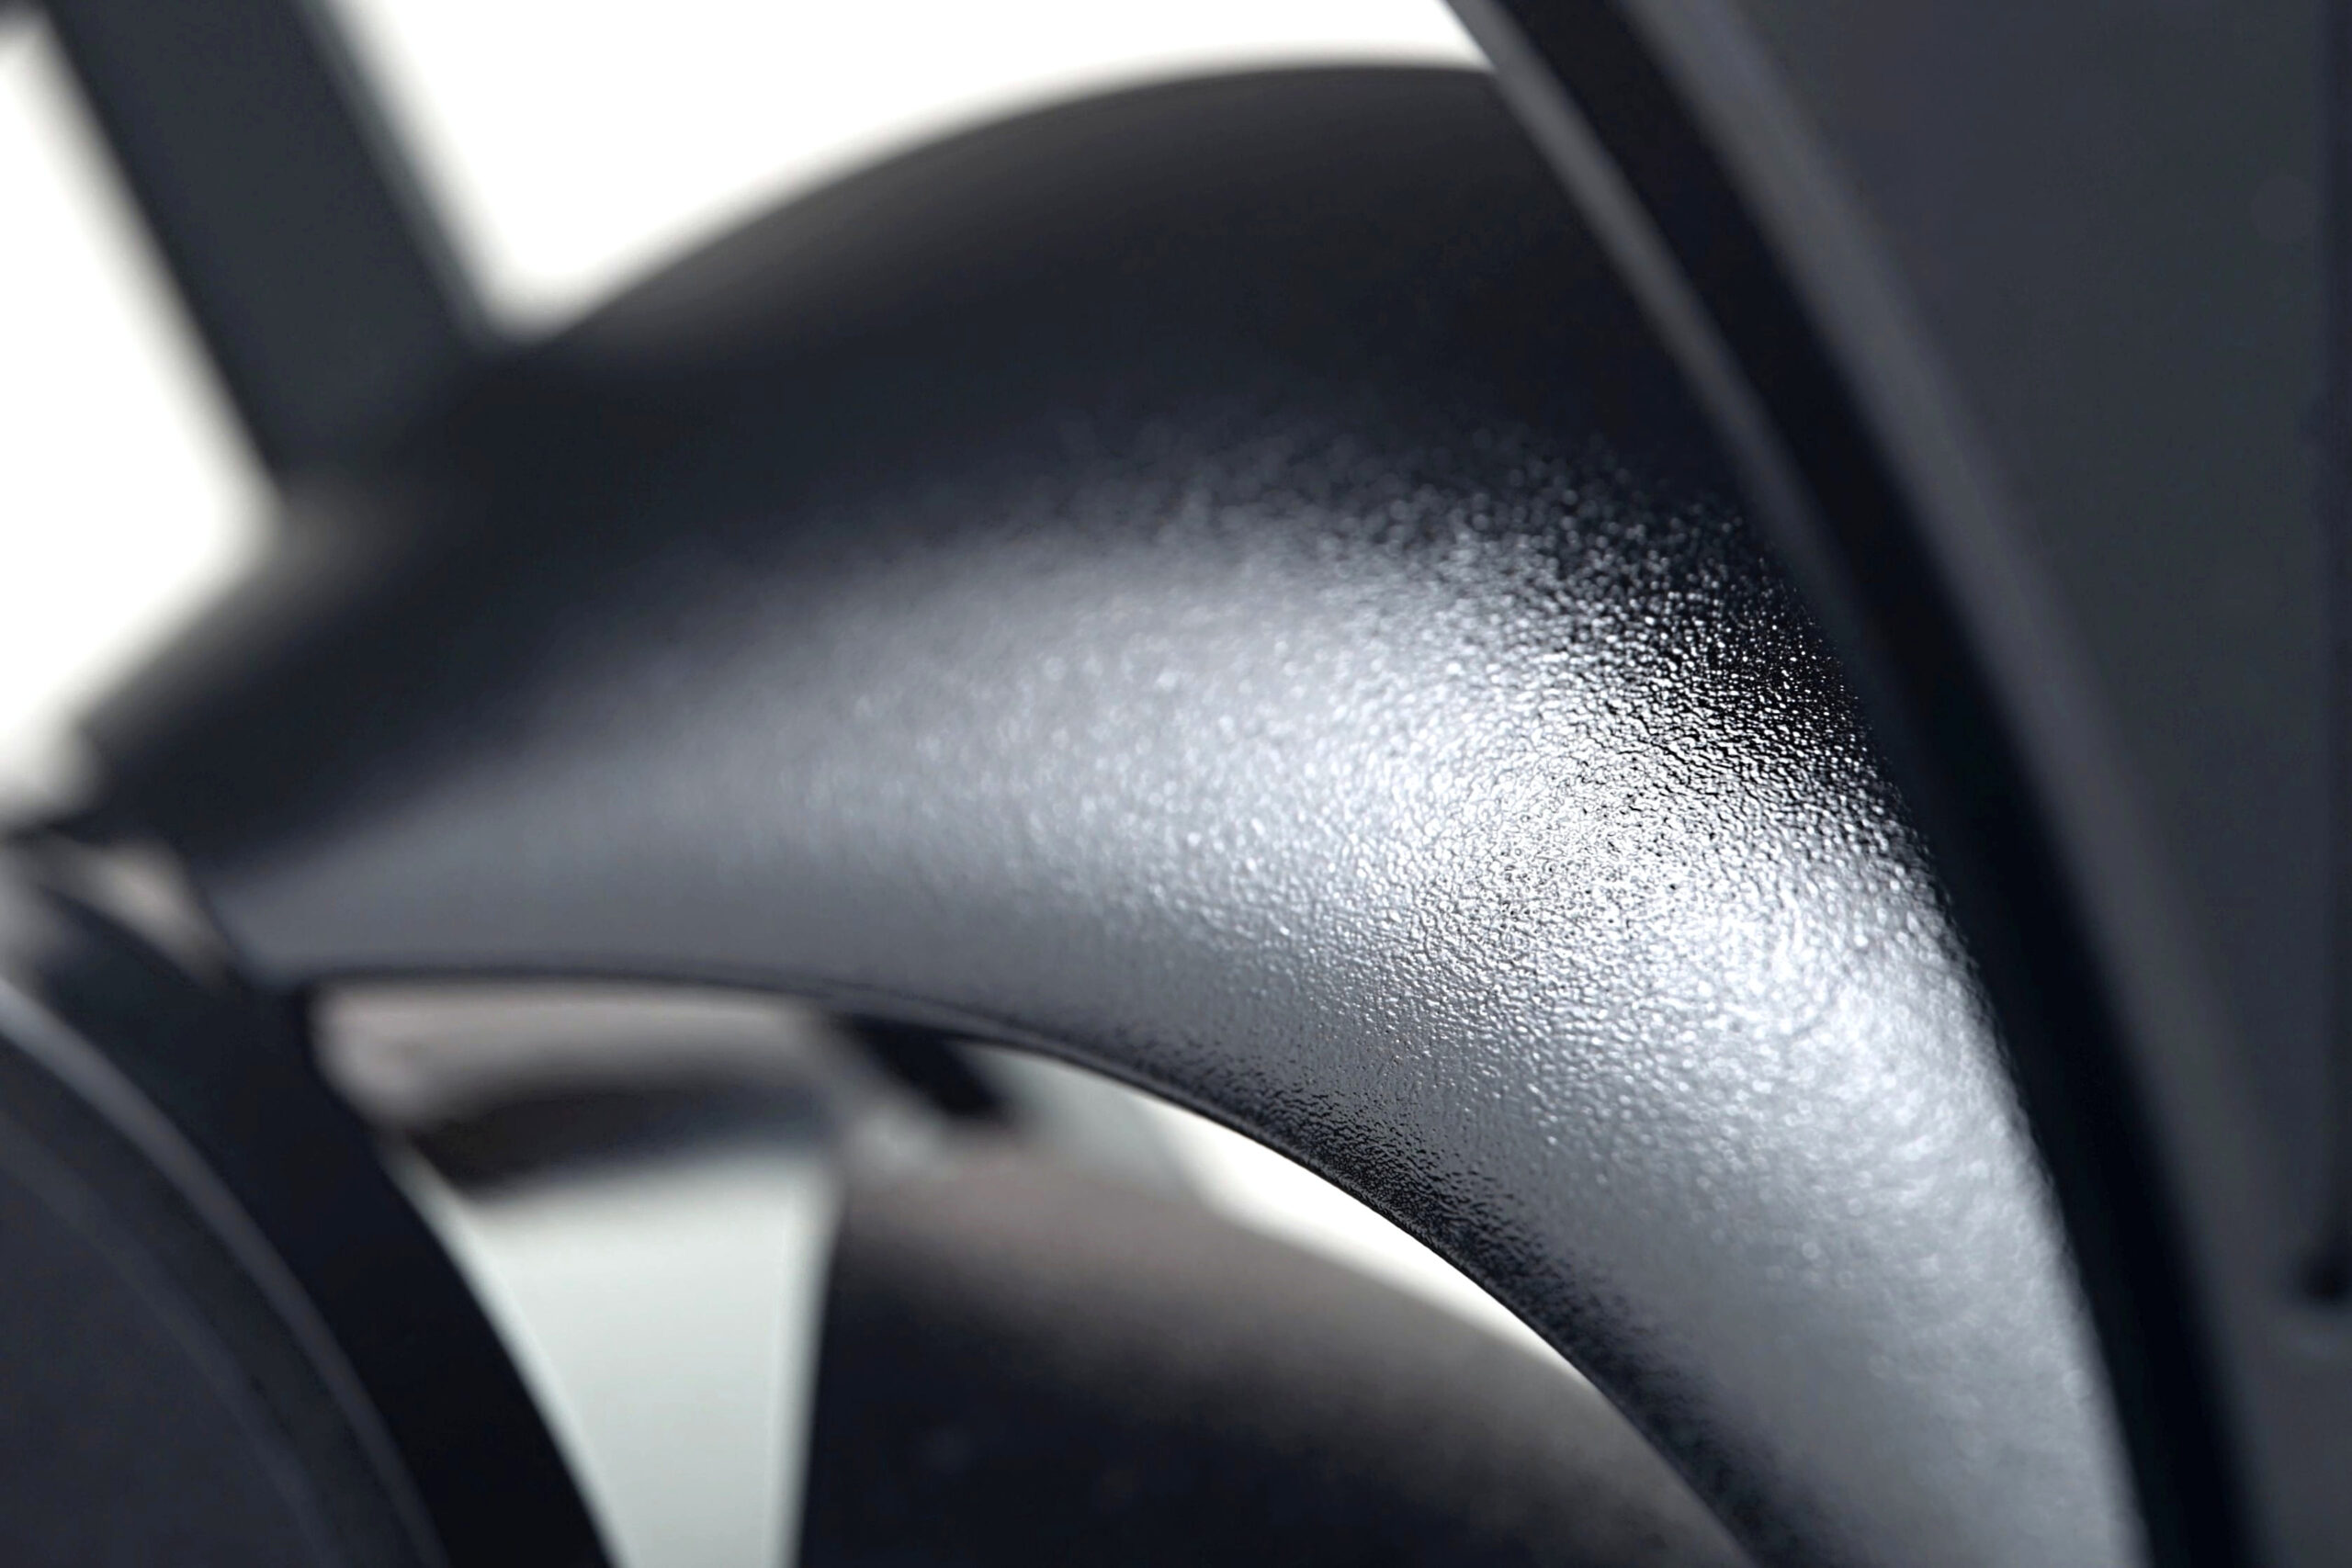
Like the noise meter, the microphone has a parabolic collar to increase resolution. The latter is specially in this case not only to amplify but also to filter out the noises that occur whether we want them or not behind the microphone. We are talking about the physical activity of the user (tester). Without this addition, human breathing, for example, would also be picked up by the spectrograph. However, this is successfully reflected off the microphone sensor by the back (convex) side of the collar. As a result, the spectrogram only contains information about the sound emitted by the fan itself.




Hi, could you review the seasonic maxflow 120 by any chance?
It has insane specs (at least on paper)
Thank you.
https://seasonic.com/maxflow-120mm/
Yes, the Seasonic MaxFlow fans will appear in our tests. We already have samples in the test lab. The BioniX P1x A-RGB models that Arctic is launching this week will have priority for now. After that, we’ll move on to the MaxFlows or the Noiseblocker fans that have been sitting on the back burner for “a hundred years.” 🙂