


AMD has also upgraded the lower-end Radeons, and the RX 7600 with RDNA 3 architecture represents a really cheap graphics card. All things considered, it’s fair to say that, at least until the arrival of the GeForce RTX 4060, it’s the best value you can get for Full HD gaming. And did you know that the RX 7600 also dominates in simpler workstation environments that benefit from GPU performance?
Frequency response of sound
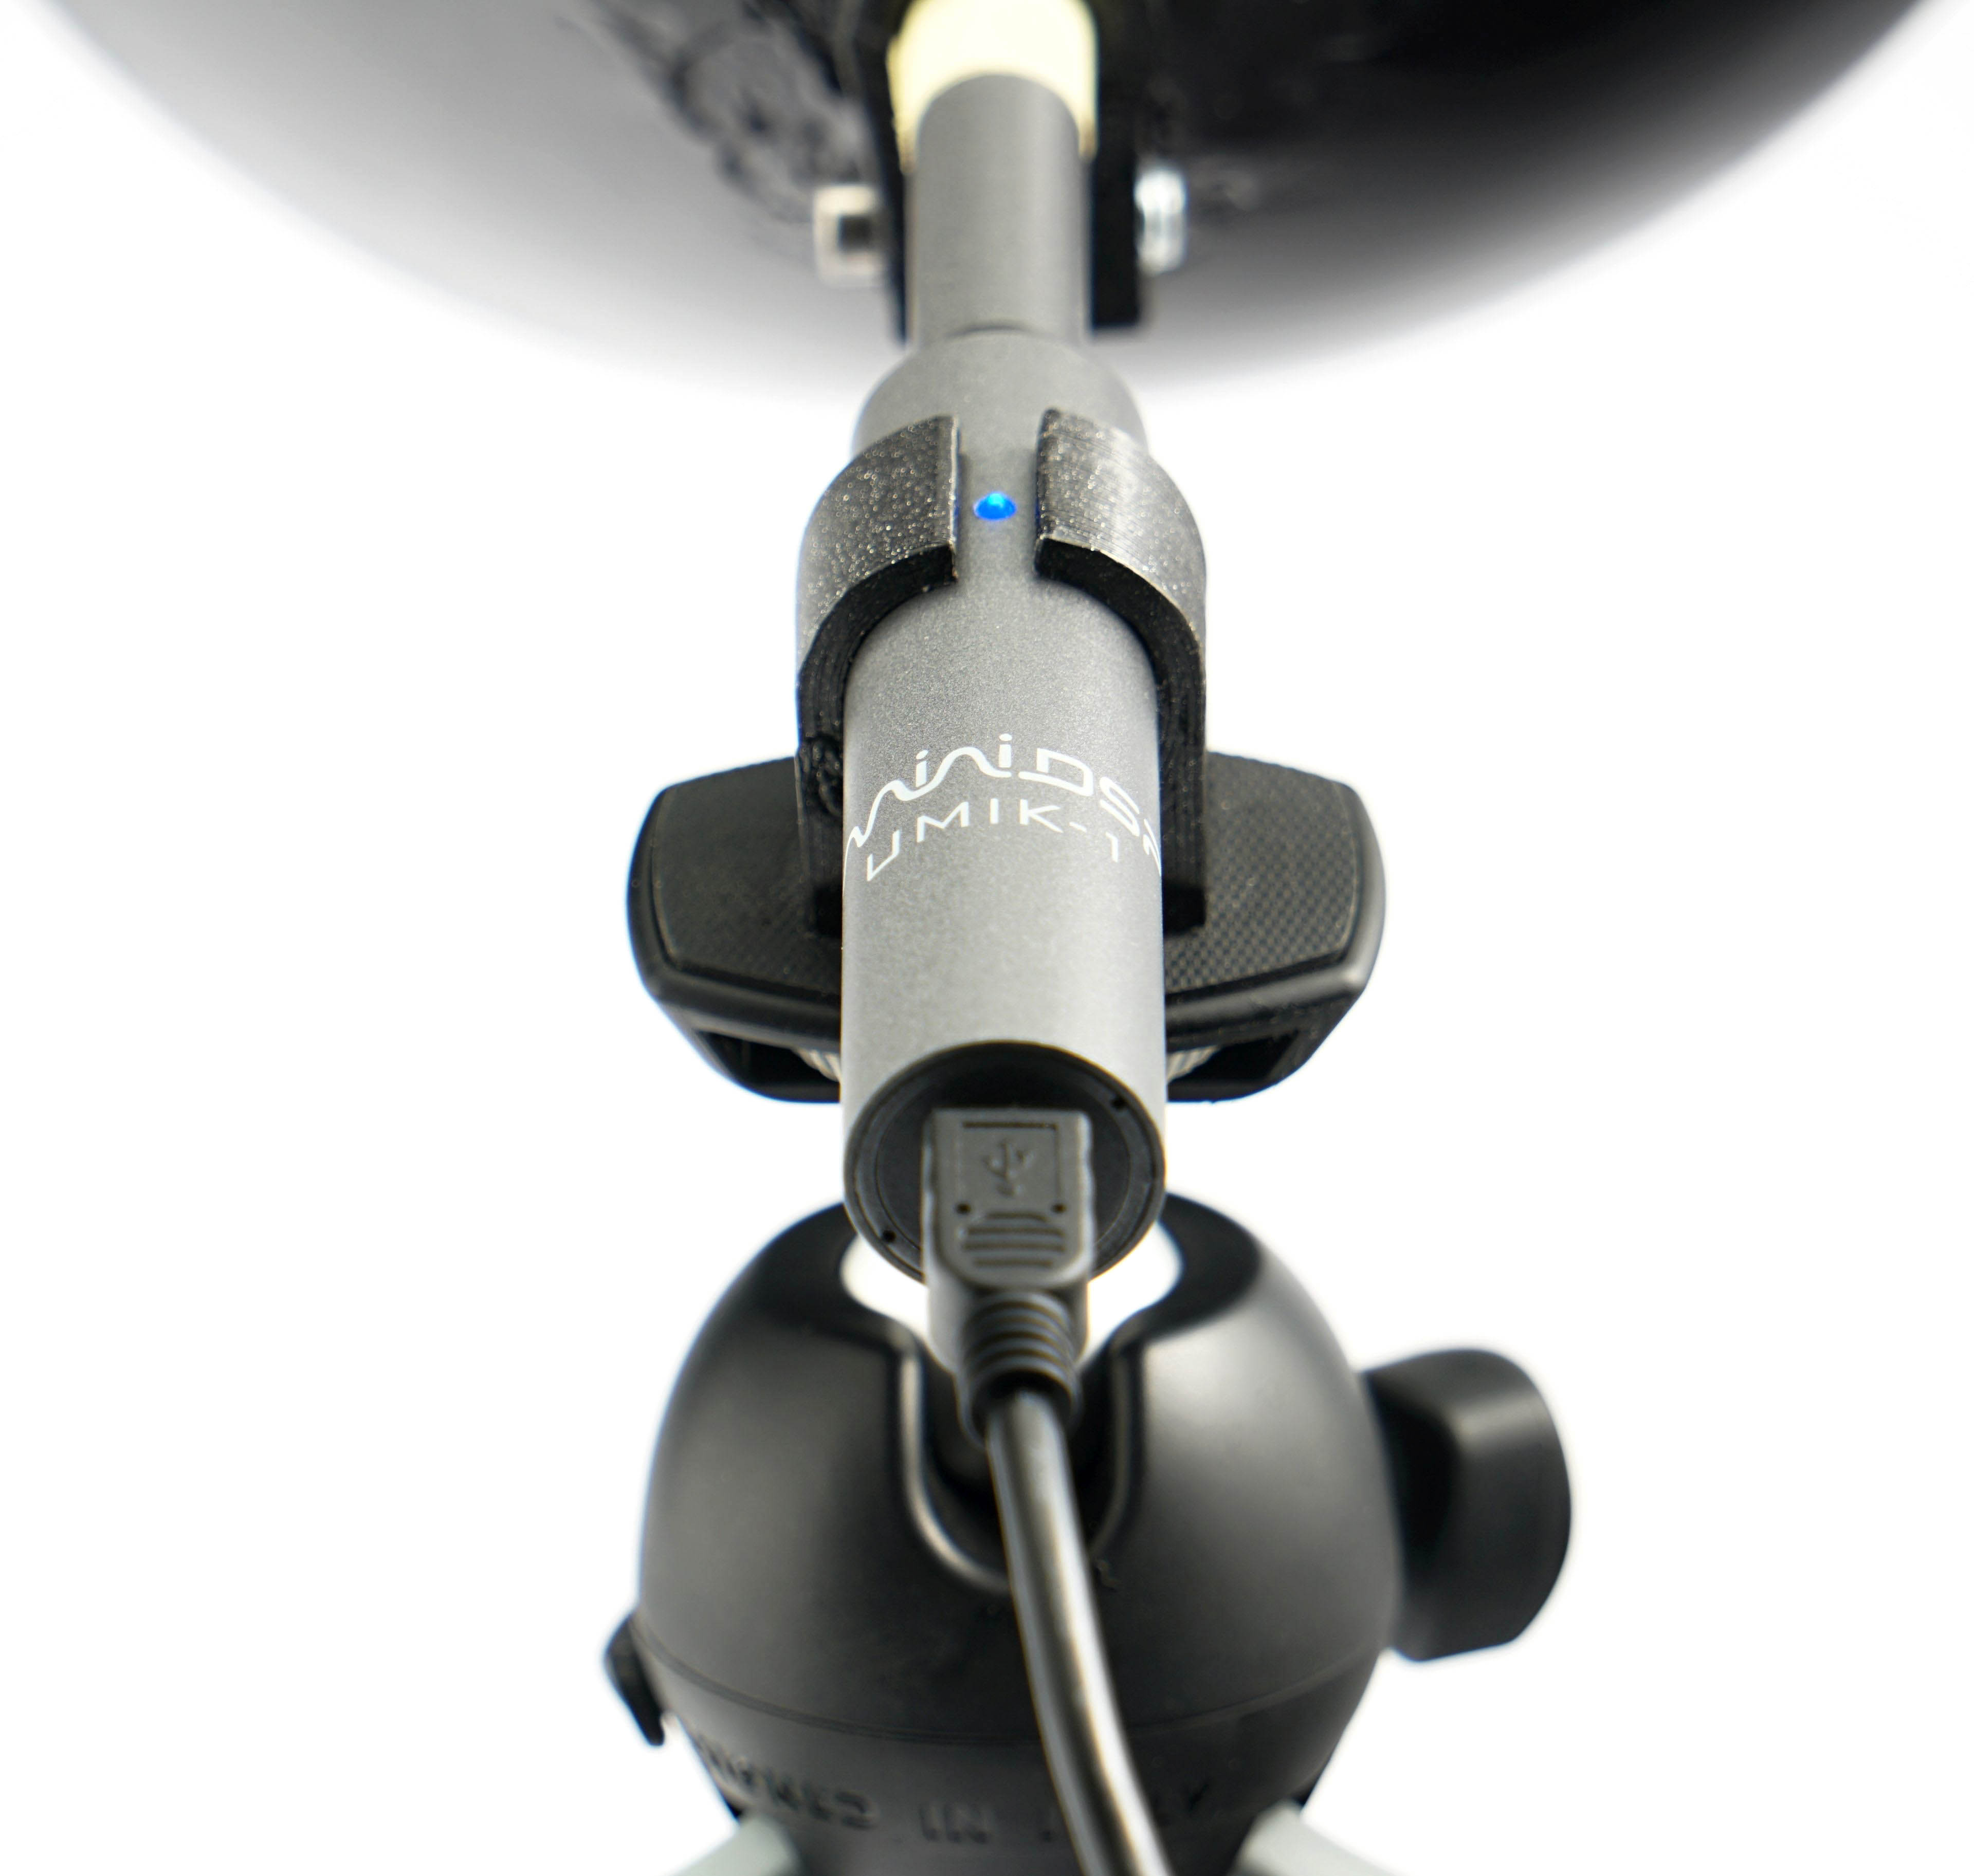
Measurements are performed in the TrueRTA application, which records sound in a range of 240 frequencies in the recorded range of 20–20,000 Hz. For the possibility of comparison across articles, we export the dominant frequency from the low (20–200 Hz), medium (201–2,000 Hz) and high (2,001–20,000 Hz) range to standard bar graphs.
However, for an even more detailed analysis of the sound expression, it is important to perceive the overall shape of the graph and the intensity of all frequencies/tones. If you don’t understand something in the graphs or tables below, you’ll find the answers to all your questions in this article. This explains how to read the measured data below correctly.
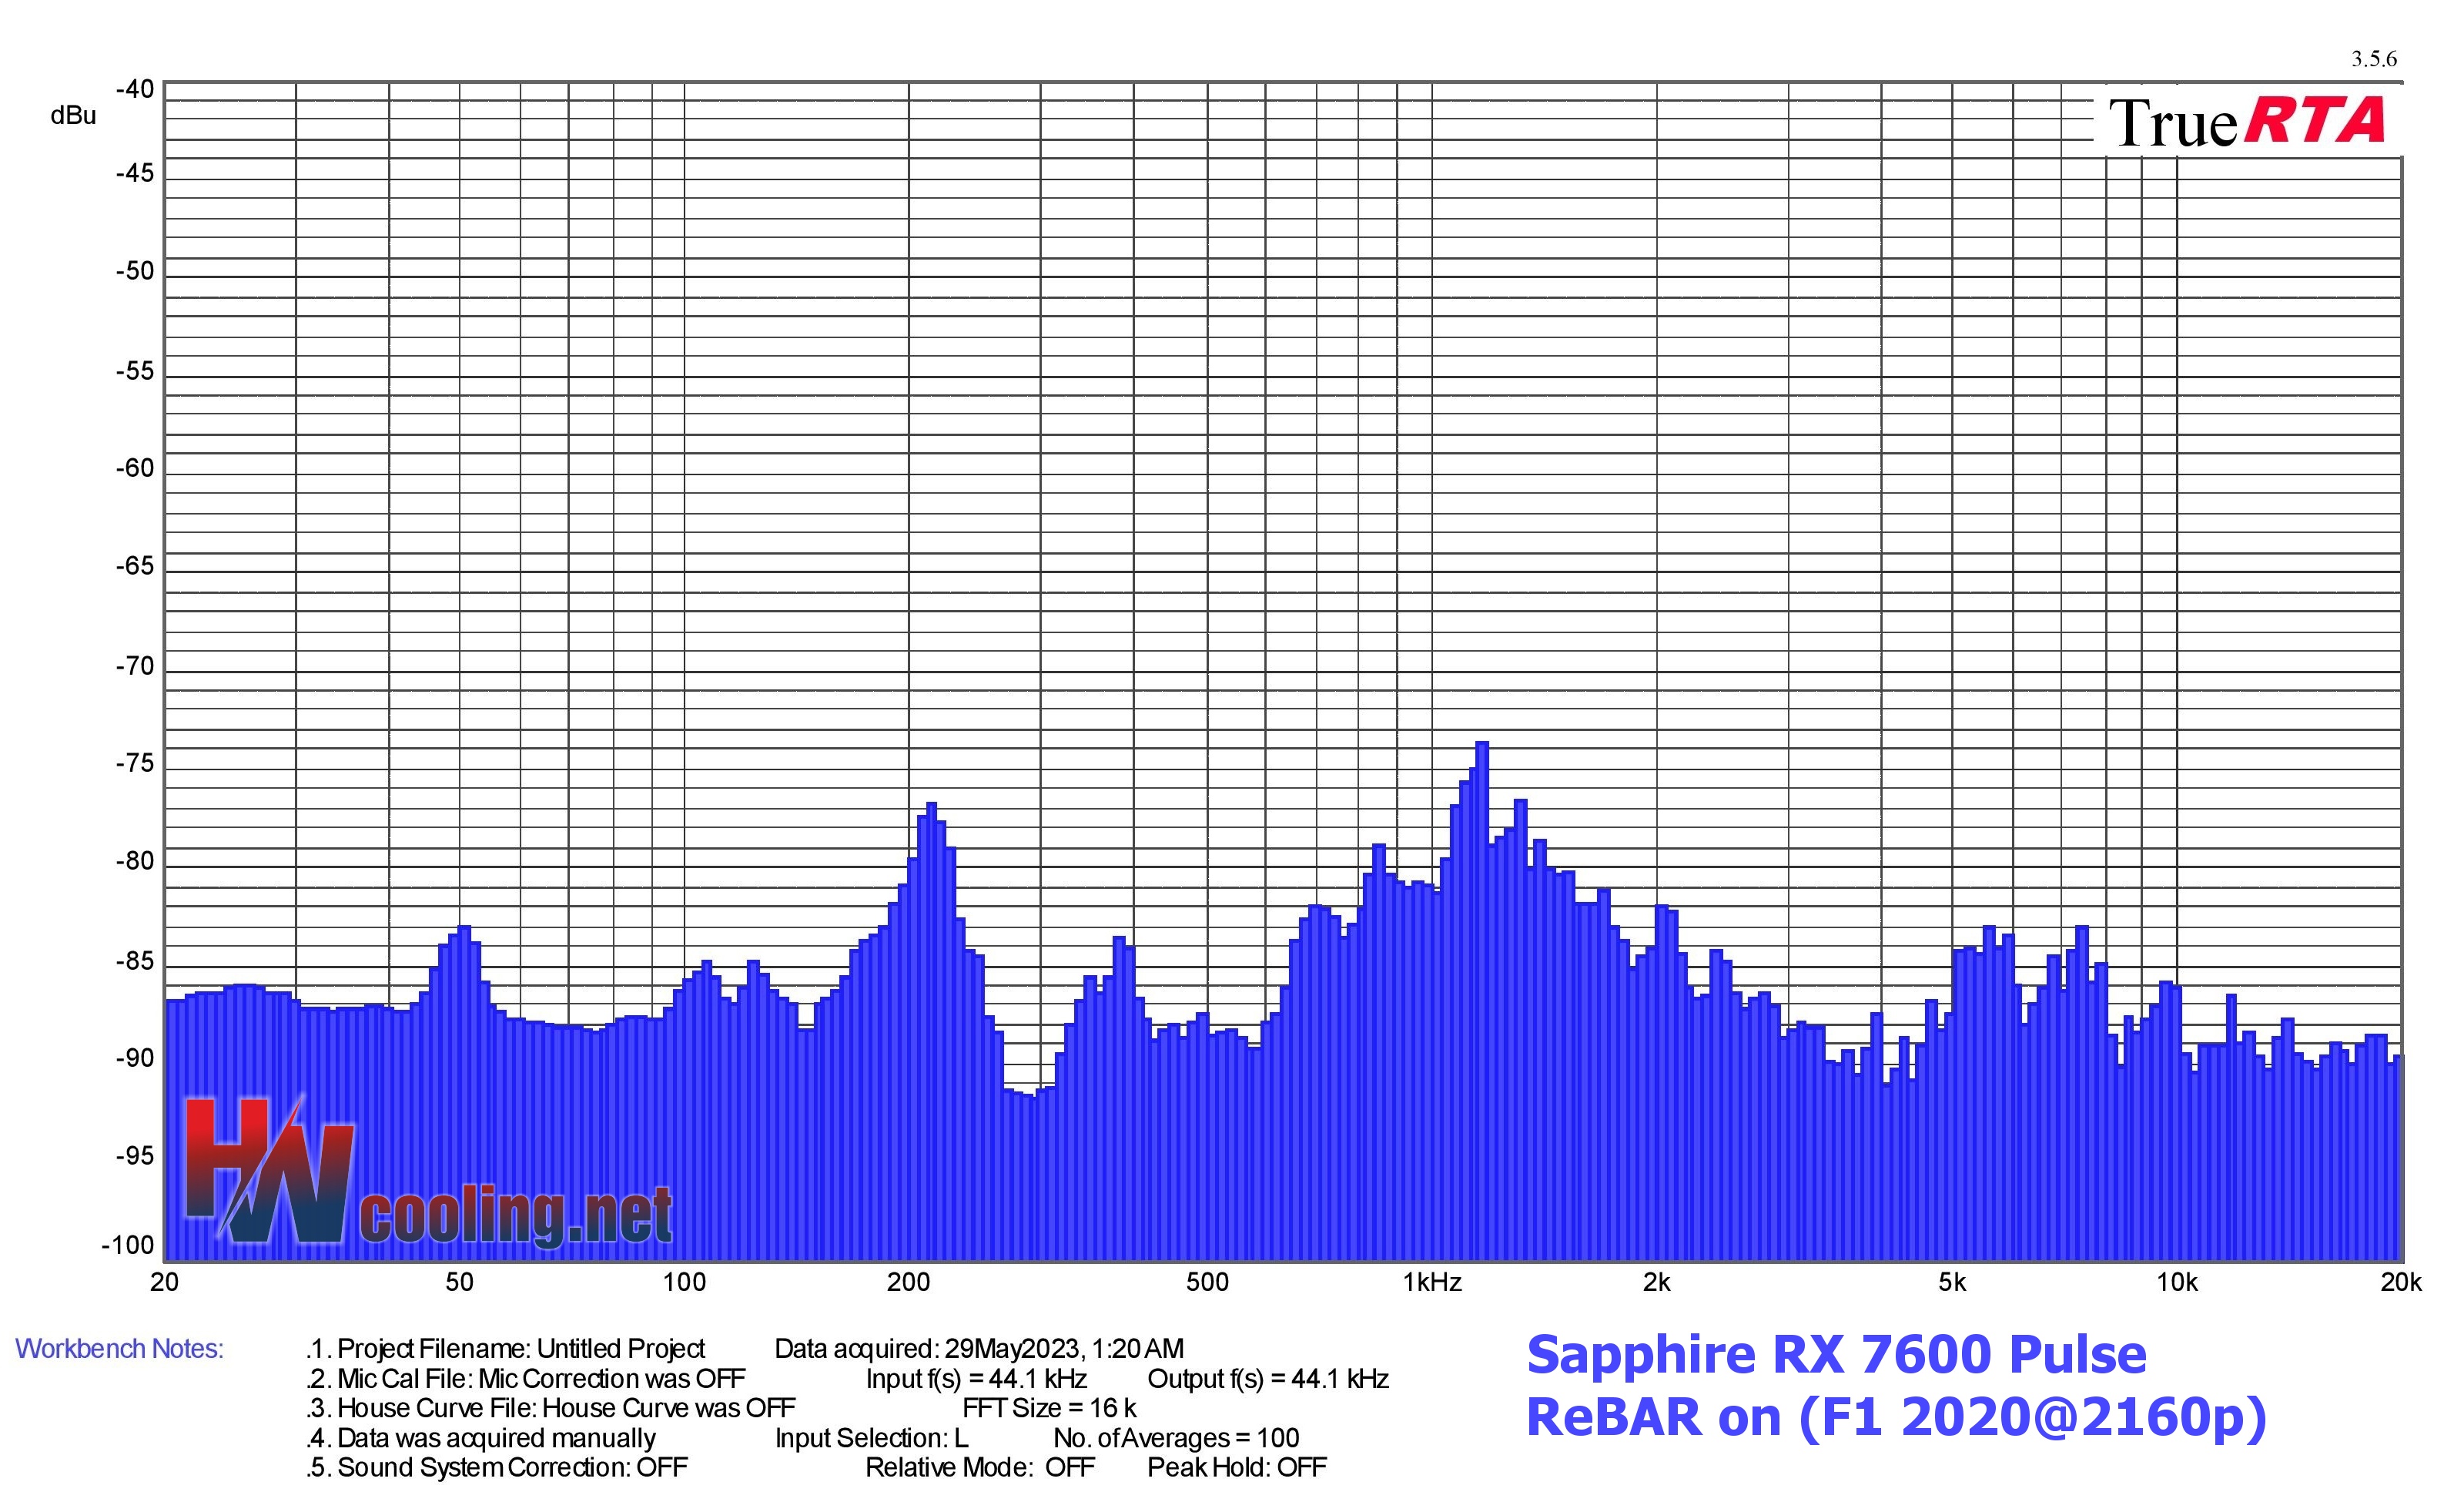
| Graphics card | Dominant sound freq. and noise level in F1 2020@2160p | NF-F12 PWM | NF-A15 PWM | ||||
| Low range | Mid range | High range | |||||
| Frequency [Hz] | Noise level [dBu] | Frequency [Hz] | Noise level [dBu] | Frequency [Hz] | Noise level [dBu] | ||
| Sapphire RX 7600 Pulse, ReBAR on | 195,8 | -80,9 | 1173,8 | -73,7 | 5583,4 | -83,0 | |
| MSI RTX 4060 Ti Gaming X Trio 8G, ReBAR on | 106,8 | -80,9 | 213,6 | -81,3 | 5424,5 | -76,0 | |
| Gigabyte RTX 4090 Gaming OC 24G (OC), ReBAR on | 195,8 | -69,4 | 1045,7 | -62,1 | 5270,0 | -83,9 | |
| Sapphire RX 7900 XT Pulse, ReBAR on | 100,8 | -75,1 | 213,6 | -70,9 | 6450,8 | -82,4 | |
| MSI RTX 4070 Ti Suprim X 12G (G), ReBAR on | 97,9 | -77,0 | 1107,9 | -74,1 | 5747,0 | -81,8 | |
| MSI RTX 4080 16GB Suprim X (G), ReBAR on | 71,3 | -77,2 | 1076,3 | -69,3 | 11830,8 | -75,4 | |
| MSI RTX 3050 Ventus 2X 8G OC, ReBAR off | 138,5 | -78,8 | 1107,9 | -78,6 | 2031,9 | -84,8 | |
| MSI RTX 3050 Ventus 2X 8G OC, ReBAR on | 123,4 | -81,2 | 1107,9 | -80,0 | 18245,6 | -83,7 | |
| Sapphire RX 6650 XT Nitro+ (P), ReBAR on | 50,4 | -83,3 | 1107,9 | -72,4 | 7240,8 | -82,5 | |
| Sapphire RX 6650 XT Nitro+ (P), ReBAR off | 184,9 | -82,3 | 1107,9 | -71,4 | 6834,4 | -82,2 | |
| Sapphire RX 6600 XT Pulse, ReBAR on | Sapphire RX 6600 XT Pulse, ReBAR on | 100,8 | -71,8 | 1356,1 | -72,7 | 6088,7 | -80,9 |
| Sapphire RX 6600 XT Pulse, ReBAR off | Sapphire RX 6600 XT Pulse, ReBAR off | 100,8 | -71,8 | 219,8 | -74,5 | 6088,7 | -81,0 |
| Aorus RTX 3080 Xtreme 10G (OC), ReBAR on | 50,4 | -77,0 | 1076,3 | -56,5 | 2031,9 | -69,4 | |
| Aorus RTX 3080 Xtreme 10G (OC), ReBAR off | 50,4 | -75,9 | 1076,3 | -56,7 | 2031,9 | -69,6 | |
| Sapphire RX 6900 XT Toxic LE (P), ReBAR on | Sapphire RX 6900 XT Toxic LE (P), ReBAR on | 138,5 | -62,4 | 1107,9 | -56,6 | 11166,8 | -74,7 |
| Sapphire RX 6900 XT Toxic LE (P), ReBAR off | Sapphire RX 6900 XT Toxic LE (P), ReBAR on | 138,5 | -61,9 | 1107,9 | -55,6 | 5747,0 | -74,7 |
| Sapphire RX 6700 XT Nitro+ (P), ReBAR on | 100,8 | -73,2 | 1076,3 | -71,2 | 7034,6 | -76,5 | |
| Sapphire RX 6700 XT Nitro+ (P), ReBAR off | 100,8 | -75,2 | 1076,3 | -73,5 | 7034,6 | -76,5 | |
| MSI RTX 3060 Ti Gaming X Trio, ReBAR off | 100,8 | -70,6 | 1107,9 | -82,8 | 7034,6 | -83,7 | |
| Gigabyte RTX 3060 Eagle OC 12G, ReBAR off | 100,8 | -71,6 | 213,6 | -64,3 | 2031,9 | -74,2 | |
| MSI RTX 3090 Gaming X Trio, ReBAR off | 100,8 | -72,3 | 1076,3 | -76,0 | 4561,4 | -81,2 | |
| MSI RTX 3070 Gaming X Trio, ReBAR off | 100,8 | -73,9 | 1076,3 | -79,7 | 6267,2 | -85,1 | |
| AMD Radeon RX 6800, ReBAR on | 100,8 | -71,0 | 1076,3 | -66,5 | 9665,3 | -81,3 | |
| AMD Radeon RX 6800, ReBAR off | 100,8 | -71,8 | 1107,9 | -67,4 | 2091,4 | -75,3 | |
| TUF RTX 3080 O10G Gaming, ReBAR off | 100,8 | -76,0 | 1107,9 | -77,9 | 7034,6 | -74,4 | |
| AMD Radeon RX 6800 XT, ReBAR on | 100,8 | -71,6 | 1107,9 | -74,7 | 10848,9 | -76,3 | |
| AMD Radeon RX 6800 XT, ReBAR off | 100,8 | -73,0 | 1107,9 | -74,7 | 10848,9 | -76,5 |

| Graphics card | Dominant sound freq. and noise level in SOTTR@2160p | NF-F12 PWM | NF-A15 PWM | ||||
| Low range | Mid range | High range | |||||
| Frequency [Hz] | Noise level [dBu] | Frequency [Hz] | Noise level [dBu] | Frequency [Hz] | Noise level [dBu] | ||
| Sapphire RX 7600 Pulse, ReBAR on | Sapphire RX 7600 Pulse, ReBAR on | 195,8 | -80,6 | 1173,8 | -74,3 | 5915,4 | -82,8 |
| MSI RTX 4060 Ti Gaming X Trio 8G, ReBAR on | 106,8 | -80,5 | 213,6 | -80,4 | 5424,5 | -78,5 | |
| Gigabyte RTX 4090 Gaming OC 24G (OC), ReBAR on | 195,8 | -72,7 | 1045,7 | -64,7 | 8365,6 | -83,1 | |
| Sapphire RX 7900 XT Pulse, ReBAR on | 100,8 | -74,4 | 213,6 | -70,8 | 5915,4 | -79,7 | |
| MSI RTX 4070 Ti Suprim X 12G (G), ReBAR on | 100,8 | -77,9 | 1076,3 | -77,9 | 5583,4 | -82,2 | |
| MSI RTX 4080 16GB Suprim X (G), ReBAR on | 190,3 | -78,4 | 1045,7 | -74,4 | 11830,8 | -75,3 | |
| MSI RTX 3050 Ventus 2X 8G OC, ReBAR off | 138,5 | -78,4 | 1140,4 | -78,5 | 2031,9 | -84,7 | |
| MSI RTX 3050 Ventus 2X 8G OC, ReBAR on | 138,5 | -78,3 | 1107,9 | -78,4 | 2031,9 | -84,6 | |
| Sapphire RX 6650 XT Nitro+ (P), ReBAR on | 50,4 | -80,1 | 1107,9 | -76,5 | 6834,4 | -84,3 | |
| Sapphire RX 6650 XT Nitro+ (P), ReBAR off | 47,6 | -84,3 | 1107,9 | -75,9 | 6834,4 | -82,8 | |
| Sapphire RX 6600 XT Pulse, ReBAR on | 100,8 | -68,8 | 1356,1 | -75,7 | 6088,7 | -82,6 | |
| Sapphire RX 6600 XT Pulse, ReBAR off | 100,8 | -69,5 | 1356,1 | -74,8 | 5915,4 | -83,1 | |
| Aorus RTX 3080 Xtreme 10G (OC), ReBAR on | 44,9 | -73,0 | 1045,7 | -50,3 | 2031,9 | -60,5 | |
| Aorus RTX 3080 Xtreme 10G (OC), ReBAR off | 41,8 | -72,6 | 1076,3 | -51,4 | 2031,9 | -60,7 | |
| Sapphire RX 6900 XT Toxic LE (P), ReBAR on | Sapphire RX 6900 XT Toxic LE (P), ReBAR on | 138,5 | -63,1 | 1140,4 | -57,9 | 5747,0 | -74,7 |
| Sapphire RX 6900 XT Toxic LE (P), ReBAR off | Sapphire RX 6900 XT Toxic LE (P), ReBAR off | 134,5 | -61,7 | 1107,9 | -58,6 | 5747,0 | -74,2 |
| Sapphire RX 6700 XT Nitro+ (P), ReBAR on | 100,8 | -73,9 | 1140,4 | -75,4 | 5915,4 | -77,2 | |
| Sapphire RX 6700 XT Nitro+ (P), ReBAR off | 100,8 | -75,1 | 1107,9 | -75,2 | 5915,4 | -76,5 | |
| MSI RTX 3060 Ti Gaming X Trio, ReBAR off | 100,8 | -70,8 | 1076,3 | -83,6 | 7034,6 | -81,9 | |
| Gigabyte RTX 3060 Eagle OC 12G, ReBAR off | 100,8 | -71,9 | 213,6 | -64,5 | 2031,9 | -73,8 | |
| MSI RTX 3090 Gaming X Trio, ReBAR off | 106,8 | -74,5 | 213,6 | -71,3 | 4561,4 | -79,3 | |
| MSI RTX 3070 Gaming X Trio, ReBAR off | 100,8 | -73,0 | 213,6 | -72,3 | 6267,2 | -84,9 | |
| AMD Radeon RX 6800, ReBAR on | 100,8 | -71,8 | 1140,4 | -66,1 | 9948,5 | -81,3 | |
| AMD Radeon RX 6800, ReBAR off | 100,8 | -71,6 | 1140,4 | -67,8 | 9665,3 | -80,6 | |
| TUF RTX 3080 O10G Gaming, ReBAR off | 100,8 | -75,4 | 1076,3 | -72,3 | 7240,8 | -74,2 | |
| AMD Radeon RX 6800 XT, ReBAR on | 100,8 | -73,2 | 1107,9 | -73,9 | 10848,9 | -76,3 | |
| AMD Radeon RX 6800 XT, ReBAR off | 100,8 | -73,2 | 1107,9 | -75,3 | 10848,9 | -75,4 |
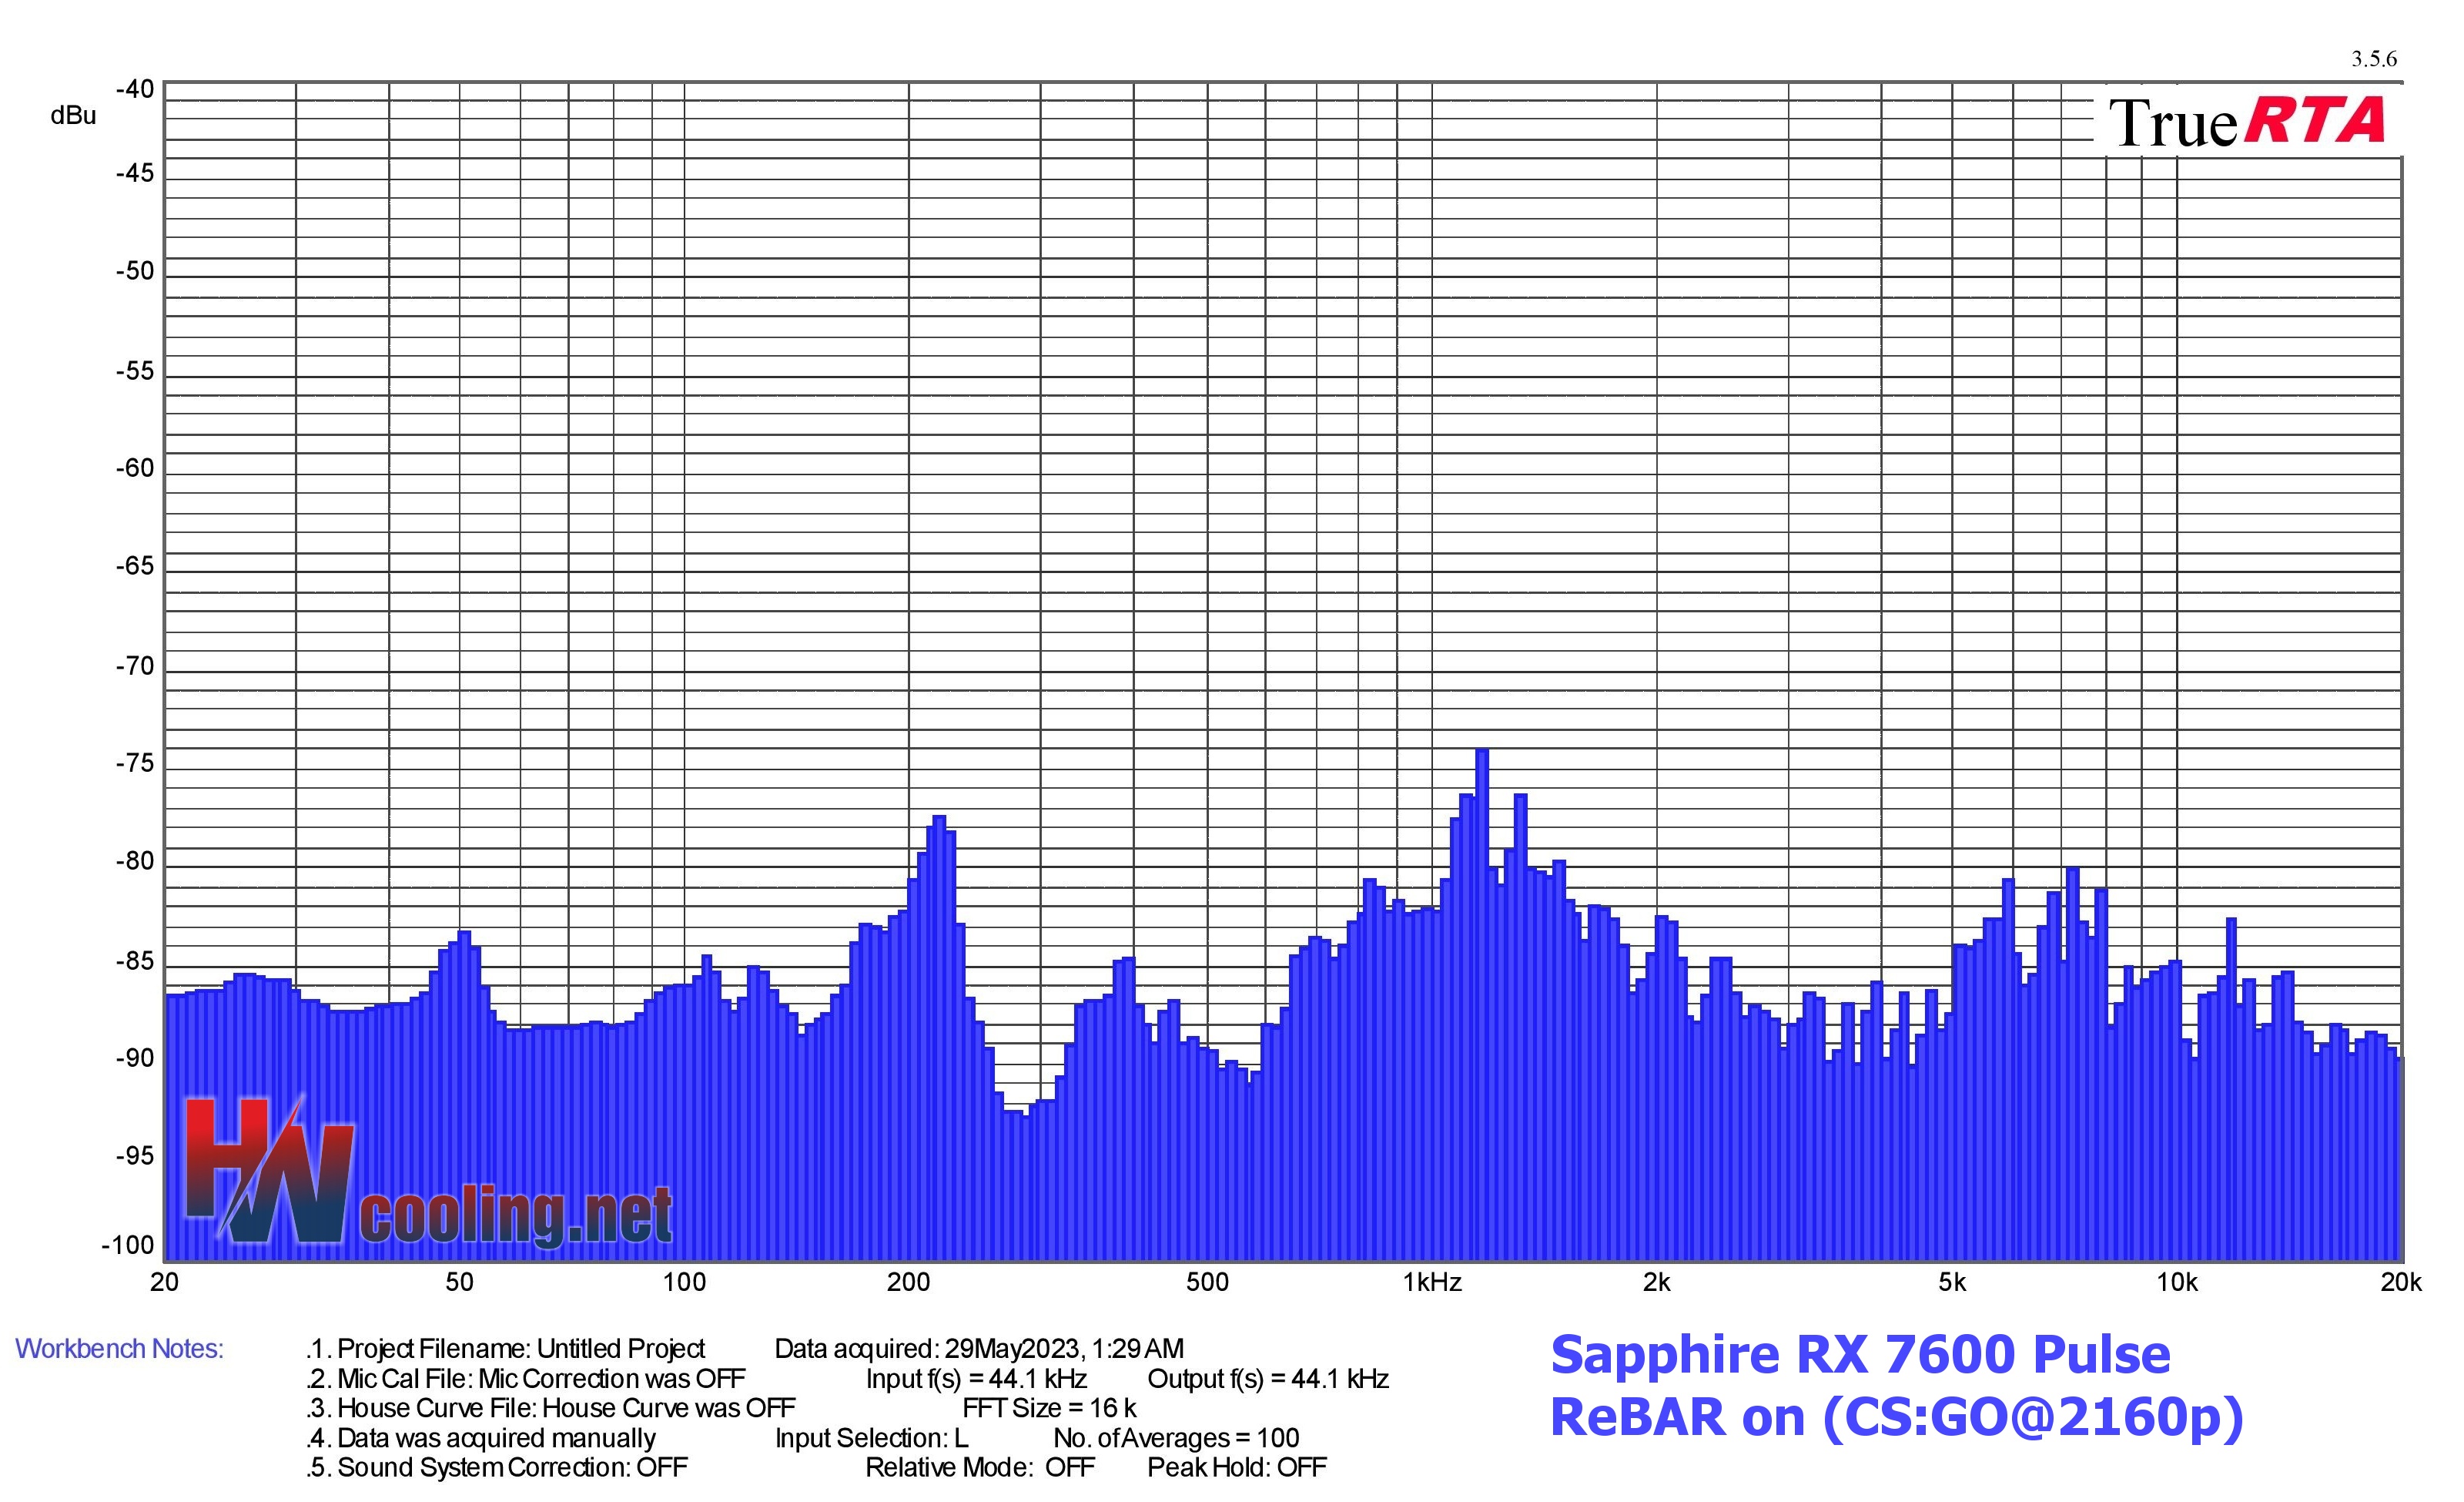
| Graphics card | Dominant sound freq. and noise level in CS:GO@2160p | NF-F12 PWM | NF-A15 PWM | ||||
| Low range | Mid range | High range | |||||
| Frequency [Hz] | Noise level [dBu] | Frequency [Hz] | Noise level [-dBu] | Frequency [Hz] | Noise level [-dBu] | ||
| Sapphire RX 7600 Pulse, ReBAR on | 195,8 | -82,2 | 1173,8 | -74,0 | 7240,8 | -80,1 | |
| MSI RTX 4060 Ti Gaming X Trio 8G, ReBAR on | 106,8 | -80,7 | 213,6 | -80,8 | 5424,5 | -77,5 | |
| Gigabyte RTX 4090 Gaming OC 24G (OC), ReBAR on | 100,8 | -73,7 | 1045,7 | -73,3 | 5747,0 | -85,8 | |
| Sapphire RX 7900 XT Pulse, ReBAR on | 100,8 | 73,7 | 213,6 | -71,4 | 5747,0 | -76,3 | |
| MSI RTX 4070 Ti Suprim X 12G (G), ReBAR on | 100,8 | -77,9 | 207,5 | -81,6 | 4305,4 | -83,5 | |
| MSI RTX 4080 16GB Suprim X (G), ReBAR on | 100,8 | -79,0 | 1076,3 | -72,2 | 11830,8 | -76,4 | |
| MSI RTX 3050 Ventus 2X 8G OC, ReBAR off | 138,5 | -79,8 | 1107,9 | -77,6 | 2031,9 | -83,4 | |
| MSI RTX 3050 Ventus 2X 8G OC, ReBAR on | 123,4 | -81,0 | 1107,9 | -77,8 | 2031,9 | -83,6 | |
| Sapphire RX 6650 XT Nitro+ (P), ReBAR on | 50,4 | -79,6 | 1107,9 | -74,2 | 7240,8 | -80,8 | |
| Sapphire RX 6650 XT Nitro+ (P), ReBAR off | 49,0 | -84,3 | 1107,9 | -80,0 | 6834,4 | -80,2 | |
| Sapphire RX 6600 XT Pulse, ReBAR on | 100,8 | -68,7 | 1356,1 | -74,7 | 6088,7 | -80,8 | |
| Sapphire RX 6600 XT Pulse, ReBAR off | 100,8 | -69,3 | 1356,1 | -75,1 | 6088,7 | -79,2 | |
| Aorus RTX 3080 Xtreme 10G (OC), ReBAR on | 47,6 | -67,1 | 1045,7 | -49,6 | 2031,9 | -60,1 | |
| Aorus RTX 3080 Xtreme 10G (OC), ReBAR off | 47,6 | -70,3 | 1140,4 | -50,8 | 2031,9 | -60,2 | |
| Sapphire RX 6900 XT Toxic LE (P), ReBAR on | Sapphire RX 6900 XT Toxic LE (P), ReBAR on | 138,5 | -64,1 | 1107,9 | -60,1 | 8610,8 | -70,9 |
| Sapphire RX 6900 XT Toxic LE (P), ReBAR off | Sapphire RX 6900 XT Toxic LE (P), ReBAR off | 134,5 | -71,6 | 1107,9 | -66,4 | 8365,6 | -72,1 |
| Sapphire RX 6700 XT Nitro+ (P), ReBAR on | 100,8 | -72,6 | 1173,8 | -74,9 | 5915,4 | -74,6 | |
| Sapphire RX 6700 XT Nitro+ (P), ReBAR off | 100,8 | -75,0 | 1107,9 | -73,8 | 5747,0 | -74,2 | |
| MSI RTX 3060 Ti Gaming X Trio, ReBAR off | 100,8 | -71,4 | 1107,9 | -83,1 | 6267,2 | -82,5 | |
| Gigabyte RTX 3060 Eagle OC 12G, ReBAR off | 100,8 | -72,6 | 213,6 | -64,8 | 2031,9 | -73,8 | |
| MSI RTX 3090 Gaming X Trio, ReBAR off | 106,8 | -75,7 | 213,6 | -73,4 | 4695,1 | -77,6 | |
| MSI RTX 3070 Gaming X Trio, ReBAR off | 106,8 | -75,7 | 213,6 | -73,4 | 6267,2 | -82,7 | |
| AMD Radeon RX 6800, ReBAR on | 100,8 | -71,2 | 1107,9 | -66,2 | 9948,5 | -77,4 | |
| AMD Radeon RX 6800, ReBAR off | 100,8 | -71,1 | 1076,3 | -77,3 | 9665,3 | -77,7 | |
| TUF RTX 3080 O10G Gaming, ReBAR off | 100,8 | -74,2 | 1076,3 | -70,9 | 7240,8 | -74,4 | |
| AMD Radeon RX 6800 XT, ReBAR on | 100,8 | -73,0 | 1107,9 | -74,3 | 7671,3 | -72,4 | |
| AMD Radeon RX 6800 XT, ReBAR off | 100,8 | -72,3 | 1107,9 | -73,7 | 10848,9 | -72,5 |
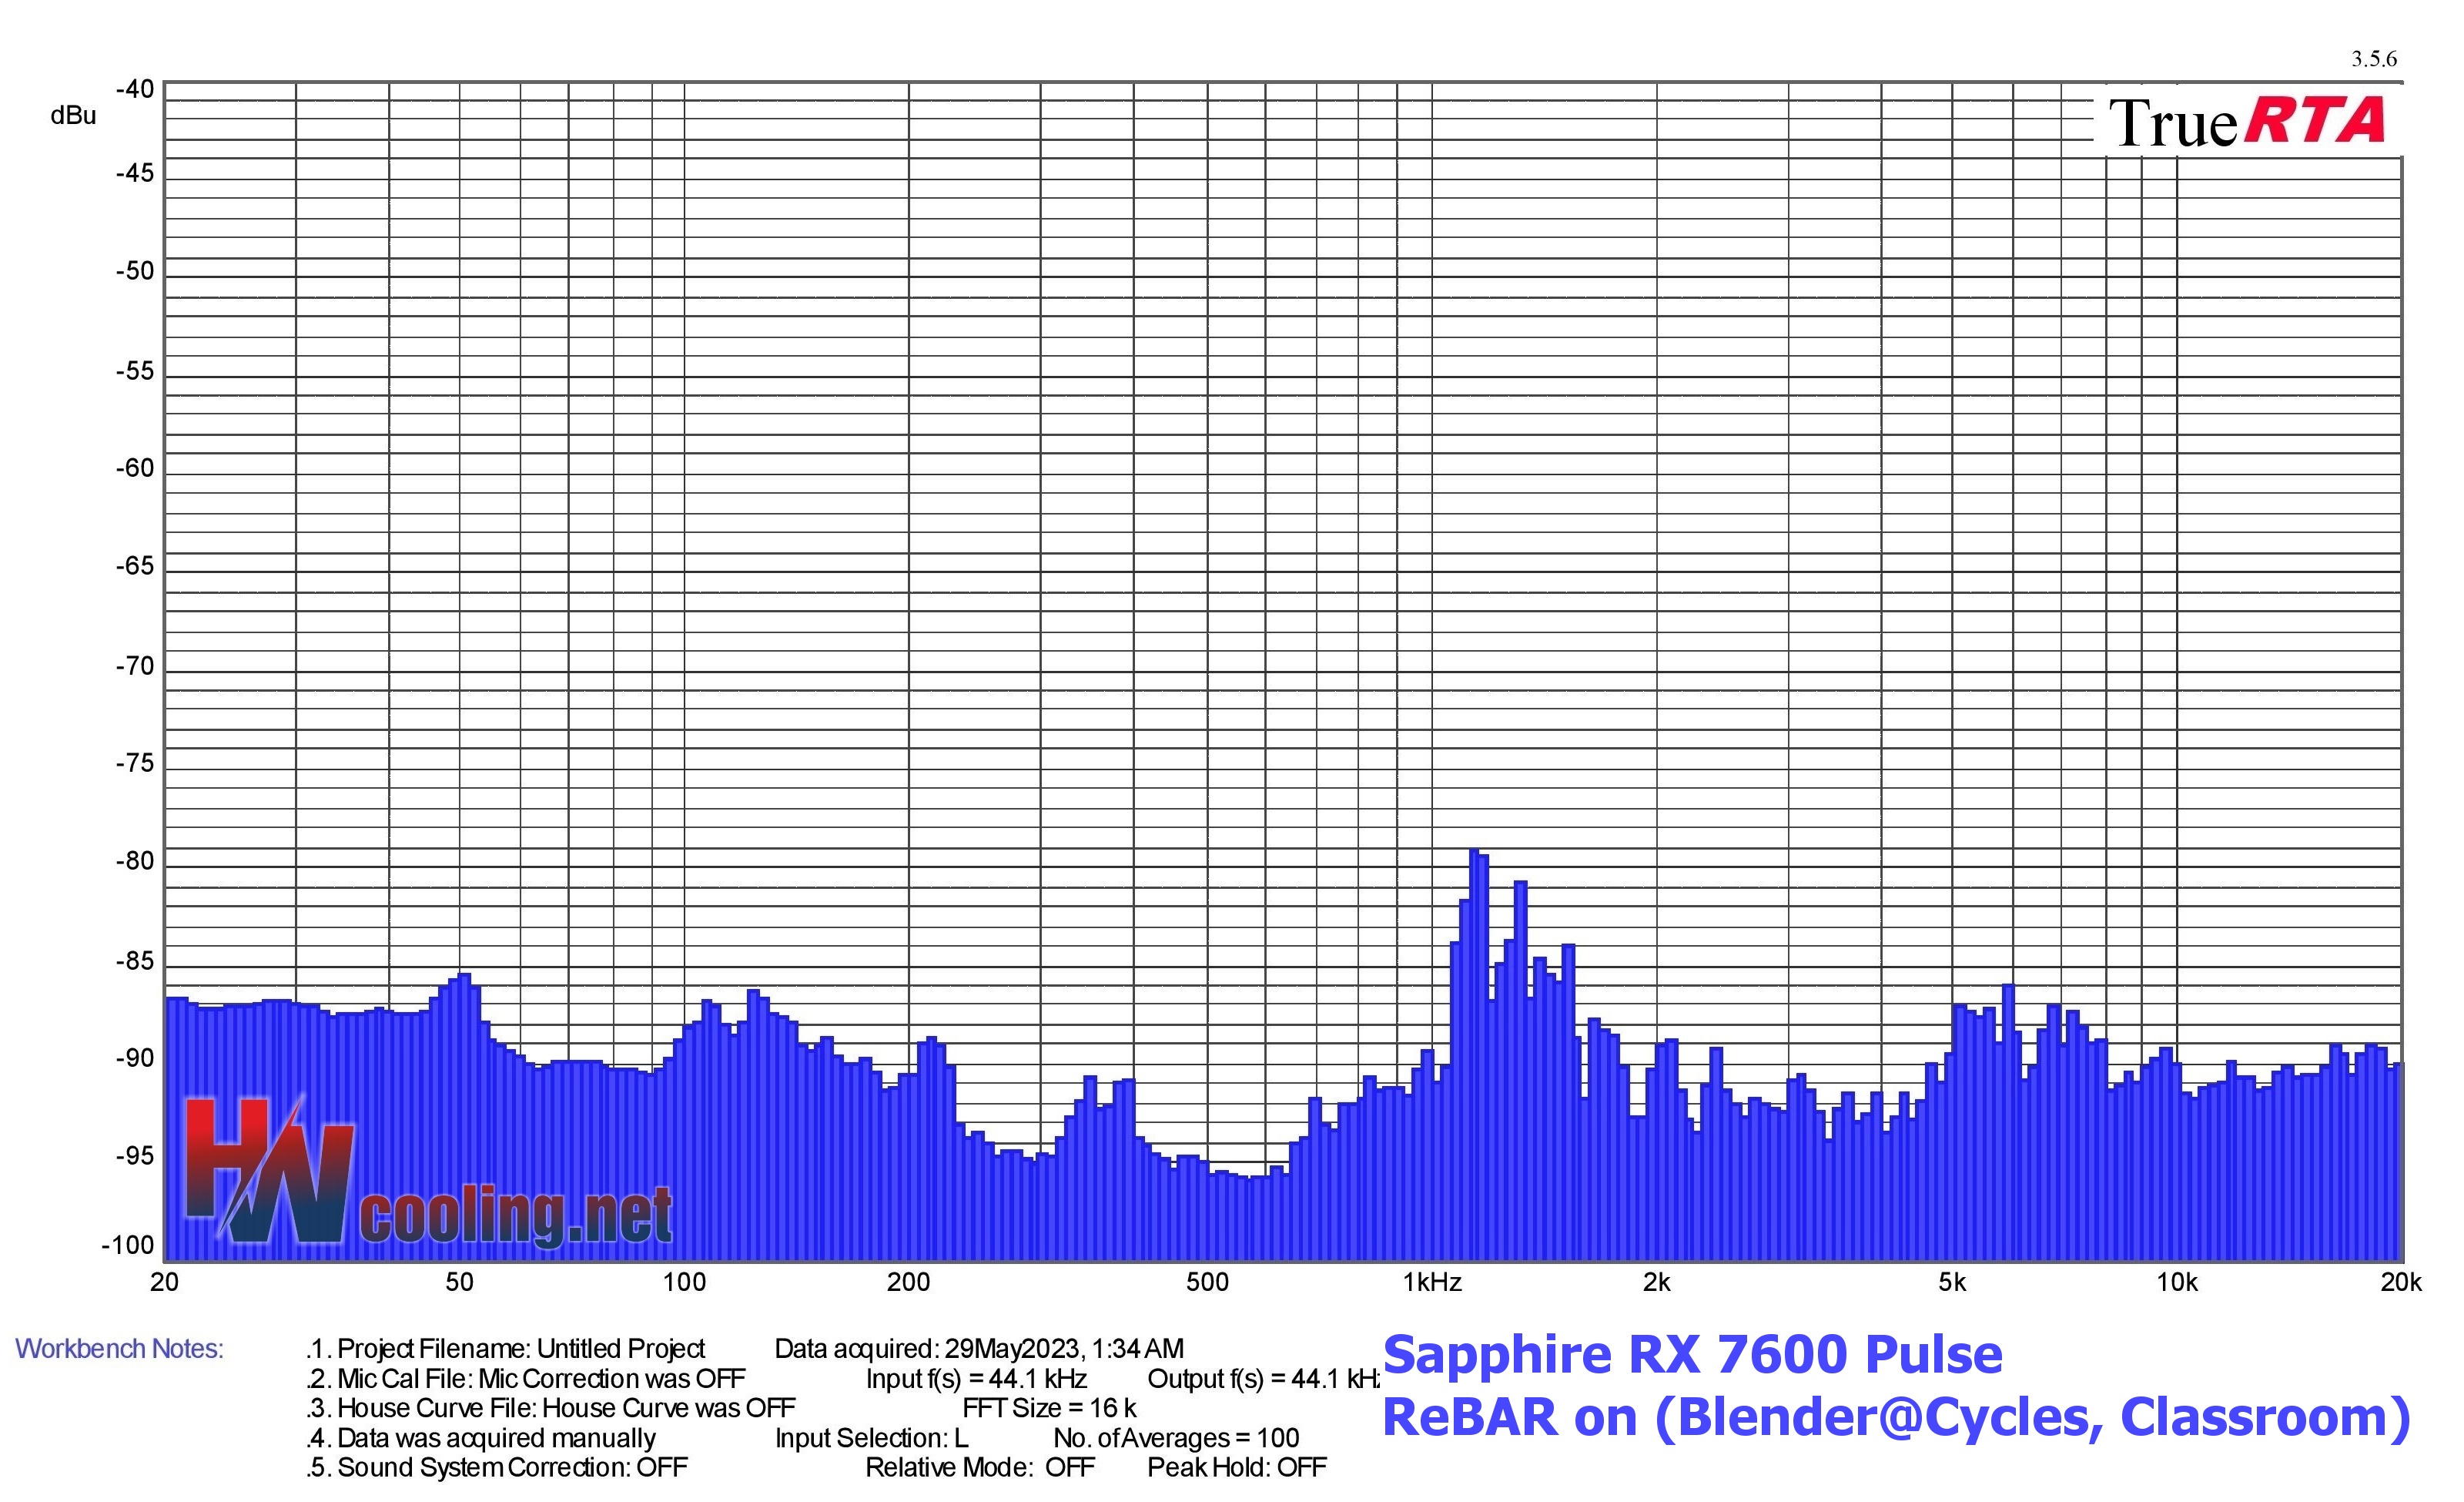
| Graphics card | Dominant sound freq. and noise level in Blender (Cycles), Classroom | NF-F12 PWM | NF-A15 PWM | ||||
| Low range | Mid range | High range | |||||
| Frequency [Hz] | Noise level [dBu] | Frequency [Hz] | Noise level [dBu] | Frequency [Hz] | Noise level [dBu] | ||
| Sapphire RX 7600 Pulse, ReBAR on | 50,4 | -85,4 | 1140,4 | -79,2 | 5915,4 | -85,9 | |
| MSI RTX 4060 Ti Gaming X Trio 8G, ReBAR on | 106,8 | -80,3 | 213,6 | -81,2 | 5424,5 | -87,6 | |
| Gigabyte RTX 4090 Gaming OC 24G (OC), ReBAR on | 195,8 | -73,7 | 1045,7 | -69,6 | 16731,3 | -87,4 | |
| Sapphire RX 7900 XT Pulse, ReBAR on | 100,8 | -73,8 | 207,5 | -74,1 | 7034,6 | -85,2 | |
| MSI RTX 4070 Ti Suprim X 12G (G), ReBAR on | 100,8 | -77,8 | 207,5 | -82,3 | 5747,0 | -89,5 | |
| MSI RTX 4080 16GB Suprim X (G), ReBAR on | 100,8 | -80,3 | 1140,4 | -86,7 | 11830,8 | -89,4 | |
| MSI RTX 3050 Ventus 2X 8G OC, ReBAR off | 123,4 | -79,3 | 213,6 | -81,4 | 18245,6 | -85,5 | |
| MSI RTX 3050 Ventus 2X 8G OC, ReBAR on | 123,4 | -79,5 | 213,6 | -81,5 | 18245,6 | -85,6 | |
| Sapphire RX 6650 XT Nitro+ (P), ReBAR on | 50,4 | -77,9 | 1107,9 | -83,5 | 7240,8 | -87,3 | |
| Sapphire RX 6650 XT Nitro+ (P), ReBAR off | 50,4 | -79,1 | 1107,9 | -83,9 | 7240,8 | -87,5 | |
| Sapphire RX 6600 XT Pulse, ReBAR on | 100,8 | -70,1 | 1356,1 | -73,4 | 5583,4 | -86,1 | |
| Sapphire RX 6600 XT Pulse, ReBAR off | 100,8 | -69,8 | 1356,1 | -73,7 | 5915,4 | -86,0 | |
| Asus GT 1030 SL 2G BRK, ReBAR off | 50,397 | -71,7 | 1107,9 | -94,9 | 19330,5 | -90,5 | |
| Aorus RTX 3080 Xtreme 10G (OC), ReBAR on | 50,4 | -76,4 | 1107,9 | -57,9 | 2031,9 | -69,7 | |
| Aorus RTX 3080 Xtreme 10G (OC), ReBAR off | 50,4 | -78,7 | 1076,3 | -60,9 | 5424,5 | -74,0 | |
| Sapphire RX 6900 XT Toxic LE (P), ReBAR on | 116,5 | -65,0 | 1107,9 | -68,5 | 5120,0 | -77,3 | |
| Sapphire RX 6900 XT Toxic LE (P), ReBAR off | 116,5 | -65,1 | 1107,9 | -68,4 | 5120,0 | -77,1 | |
| Sapphire RX 6700 XT Nitro+ (P), ReBAR on | 100,8 | -72,6 | 1173,8 | -86,6 | 5915,4 | -82,4 | |
| Sapphire RX 6700 XT Nitro+ (P), ReBAR off | 100,8 | -75,8 | 1076,3 | -87,2 | 5915,4 | -82,1 | |
| MSI RTX 3060 Ti Gaming X Trio, ReBAR off | 100,8 | -70,4 | 987,0 | -89,5 | 6450,8 | -89,0 | |
| Gigabyte RTX 3060 Eagle OC 12G, ReBAR off | 100,8 | -72,6 | 213,6 | -70,0 | 2031,9 | -79,1 | |
| MSI RTX 3090 Gaming X Trio, ReBAR off | 100,8 | -71,2 | 1076,3 | -85,3 | 5915,4 | -92,0 | |
| MSI RTX 3070 Gaming X Trio, ReBAR off | 100,8 | -71,2 | 1076,3 | -85,3 | 18245,6 | -90,8 | |
| AMD Radeon RX 6800, ReBAR on | 100,8 | -71,9 | 987,0 | -89,2 | 7452,9 | -88,3 | |
| AMD Radeon RX 6800, ReBAR off | 100,8 | -71,1 | 987,0 | -89,0 | 7452,9 | -88,2 | |
| TUF RTX 3080 O10G Gaming, ReBAR off | 106,8 | -81,5 | 1660,0 | -80,6 | 6834,4 | -78,0 | |
| AMD Radeon RX 6800 XT, ReBAR on | 97,9 | -79,8 | 1208,2 | -89,6 | 7671,3 | -85,2 | |
| AMD Radeon RX 6800 XT, ReBAR off | 100,8 | -73,0 | 1243,6 | -95,2 | 7671,3 | -85,0 |

| Graphics card | Dominant sound freq. and noise level in CS:GO@1080p (coils only*) | NF-F12 PWM | NF-A15 PWM | ||||
| Low range | Mid range | High range | |||||
| Frequency [Hz] | Noise level [dBu] | Frequency [Hz] | Noise level [dBu] | Frequency [Hz] | Noise level [dBu] | ||
| Sapphire RX 7600 Pulse, ReBAR on | 50,4 | -82,5 | 1974,0 | -87,4 | 7240,8 | -78,4 | |
| MSI RTX 4060 Ti Gaming X Trio 8G, ReBAR on | 50,4 | -84,9 | 806,3 | -78,5 | 5583,4 | -76,9 | |
| Gigabyte RTX 4090 Gaming OC 24G (OC), ReBAR on | 100,8 | -74,1 | 1317,5 | -82,3 | 5747,0 | -85,8 | |
| Sapphire RX 7900 XT Pulse, ReBAR on | 100,8 | -73,2 | 1076,3 | -81,5 | 5747,0 | -76,3 | |
| MSI RTX 4070 Ti Suprim X 12G (G), ReBAR on | 100,8 | -78,0 | 987,0 | -78,6 | 5583,4 | -84,3 | |
| MSI RTX 4080 16GB Suprim X (G), ReBAR on | 100,8 | -80,5 | 1140,4 | -71,8 | 11830,8 | -74,9 | |
| MSI RTX 3050 Ventus 2X 8G OC, ReBAR off | 50,4 | -83,6 | 1317,5 | -83,0 | 7896,1 | -83,9 | |
| MSI RTX 3050 Ventus 2X 8G OC, ReBAR on | 50,4 | -77,7 | 1317,5 | -87,3 | 10848,9 | -84,5 | |
| Sapphire RX 6650 XT Nitro+ (P), ReBAR on | 50,4 | -81,8 | 1045,7 | -84,2 | 2091,4 | -77,7 | |
| Sapphire RX 6650 XT Nitro+ (P), ReBAR off | 50,4 | -83,3 | 1974,0 | -90,0 | 7034,6 | -82,4 | |
| Sapphire RX 6600 XT Pulse, ReBAR on | 100,8 | -72,0 | 1107,9 | -83,7 | 2215,8 | -79,6 | |
| Sapphire RX 6600 XT Pulse, ReBAR off | 100,8 | -68,4 | 1917,8 | -88,7 | 6450,8 | -81,4 | |
| Asus GT 1030 SL 2G BRK, ReBAR off | 50,4 | -71,1 | 1107,9 | -91,7 | 12534,3 | -89,8 | |
| Aorus RTX 3080 Xtreme 10G (OC), ReBAR on | 50,4 | -80,6 | 1660,0 | -80,3 | 7896,1 | -80,2 | |
| Aorus RTX 3080 Xtreme 10G (OC), ReBAR off | 50,4 | -78,8 | 1660,0 | -82,6 | 7671,3 | -80,4 | |
| Sapphire RX 6900 XT Toxic LE (P), ReBAR on | Sapphire RX 6900 XT Toxic LE (P), ReBAR on | 100,8 | -74,9 | 739,4 | -67,9 | 5915,4 | -78,5 |
| Sapphire RX 6900 XT Toxic LE (P), ReBAR off | Sapphire RX 6900 XT Toxic LE (P), ReBAR off | 50,4 | -81,4 | 739,4 | -70,2 | 8610,8 | -73,6 |
| Sapphire RX 6700 XT Nitro+ (P), ReBAR on | 100,8 | -74,6 | 987,0 | -84,8 | 5747,0 | -69,6 | |
| Sapphire RX 6700 XT Nitro+ (P), ReBAR off | 100,8 | -74,7 | 1395,9 | -88,4 | 5747,0 | -70,3 | |
| MSI RTX 3060 Ti Gaming X Trio, ReBAR off | 100,8 | -73,0 | 1974,0 | -88,1 | 6267,2 | -83,6 | |
| Gigabyte RTX 3060 Eagle OC 12G, ReBAR off | 100,8 | -73,6 | 1974,0 | -90,2 | 6088,7 | -83,1 | |
| MSI RTX 3090 Gaming X Trio, ReBAR off | 50,4 | -76,1 | 987,0 | -84,8 | 5915,4 | -83,3 | |
| MSI RTX 3070 Gaming X Trio, ReBAR off | 100,8 | -74,7 | 1317,5 | -81,4 | 6088,7 | -84,6 | |
| AMD Radeon RX 6800, ReBAR on | 100,8 | -71,8 | 987,0 | -87,7 | 7452,9 | -80,4 | |
| AMD Radeon RX 6800, ReBAR off | 100,8 | -72,0 | 1660,0 | -90,4 | 8863,1 | -84,5 | |
| TUF RTX 3080 O10G Gaming, ReBAR off | 100,8 | -75,6 | 1140,4 | -81,7 | 9948,5 | -78,7 | |
| AMD Radeon RX 6800 XT, ReBAR on | 100,8 | -73,6 | 1660,0 | -79,8 | 7452,9 | -74,0 | |
| AMD Radeon RX 6800 XT, ReBAR off | 100,8 | -73,3 | 1660,0 | -83,3 | 7452,9 | -76,4 |
*The Sapphire RX 6900 XT Toxic LE is the only tested graphics card whose spectral analysis also includes the sound of the water pump.


Typical loud coil whine from Sapphire. I have a different view on the 7600 though. For me, this GPU underdelivers at 300 euros. The efficiency improvement over Navi 3 is not great. It may look OK vs insanely overclocked 6650XT, but vs 6600XT the picture will be different. It’s a mere 6nm, unlike the much more efficient 5+6nm 7900XT and XTX. When the 4060 non-Ti with identical performance (or maybe -2%) is out at 330 euros, it will be a much better buy with its 100-105W power draw in games, no crazy hotspot temps, and drivers that can be trusted. Both of them are quite bad for new titles with 8GB of VRAM and their performance is disappointing vs the last gen at the MSRP, but the 4060 can at least brag about a huge efficiency jump over the last gen. The 7600 is basically an uninspiring 6650 XT refresh in 6nm.
When it comes to gaming performance, yes the RX 7600’s efficiency is indeed equal to that of the RX 6600 XT.
To the price: It is also in my interest to have everything as cheap and high quality as possible, but I admit that I don’t understand what the problem is with RX 7600. Apart from the slightly cheaper Radeon RX 6650 XT (with many disadvantages compared to the RX 7600), the RX 7600 still has a comparable price/performance ratio. The moment the RX 6000 series ceases to exist on the market, only the RTX 4060 will be in a similar price class, which at a similar speed and at the same time significantly lower power draw will be, of course, technically more attractive, but also a more expensive option. For the casual gamer, who is more concerned with price/performance ratio than lower power draw and lower noise, there is nothing better than the RX 7600 in the end.
I don’t want to get into an opinion dispute with anyone, everyone takes different things into account when evaluating a graphics card, so we always try to test as many as possible… but the media image about how the Radeon RX 7600 is not worth it at all and how it’s garbage is far-fetched and seems really unfair to me.