


AMD has also upgraded the lower-end Radeons, and the RX 7600 with RDNA 3 architecture represents a really cheap graphics card. All things considered, it’s fair to say that, at least until the arrival of the GeForce RTX 4060, it’s the best value you can get for Full HD gaming. And did you know that the RX 7600 also dominates in simpler workstation environments that benefit from GPU performance?
Noise measurement…
Noise, as well as other operating characteristics, which we will focus on, we’re measuring in the same modes as consumption, so that the individual values overlap nicely. In addition to the level of noise produced, we also record the frequency response of the sound, the course of the GPU clock speed and its temperature.
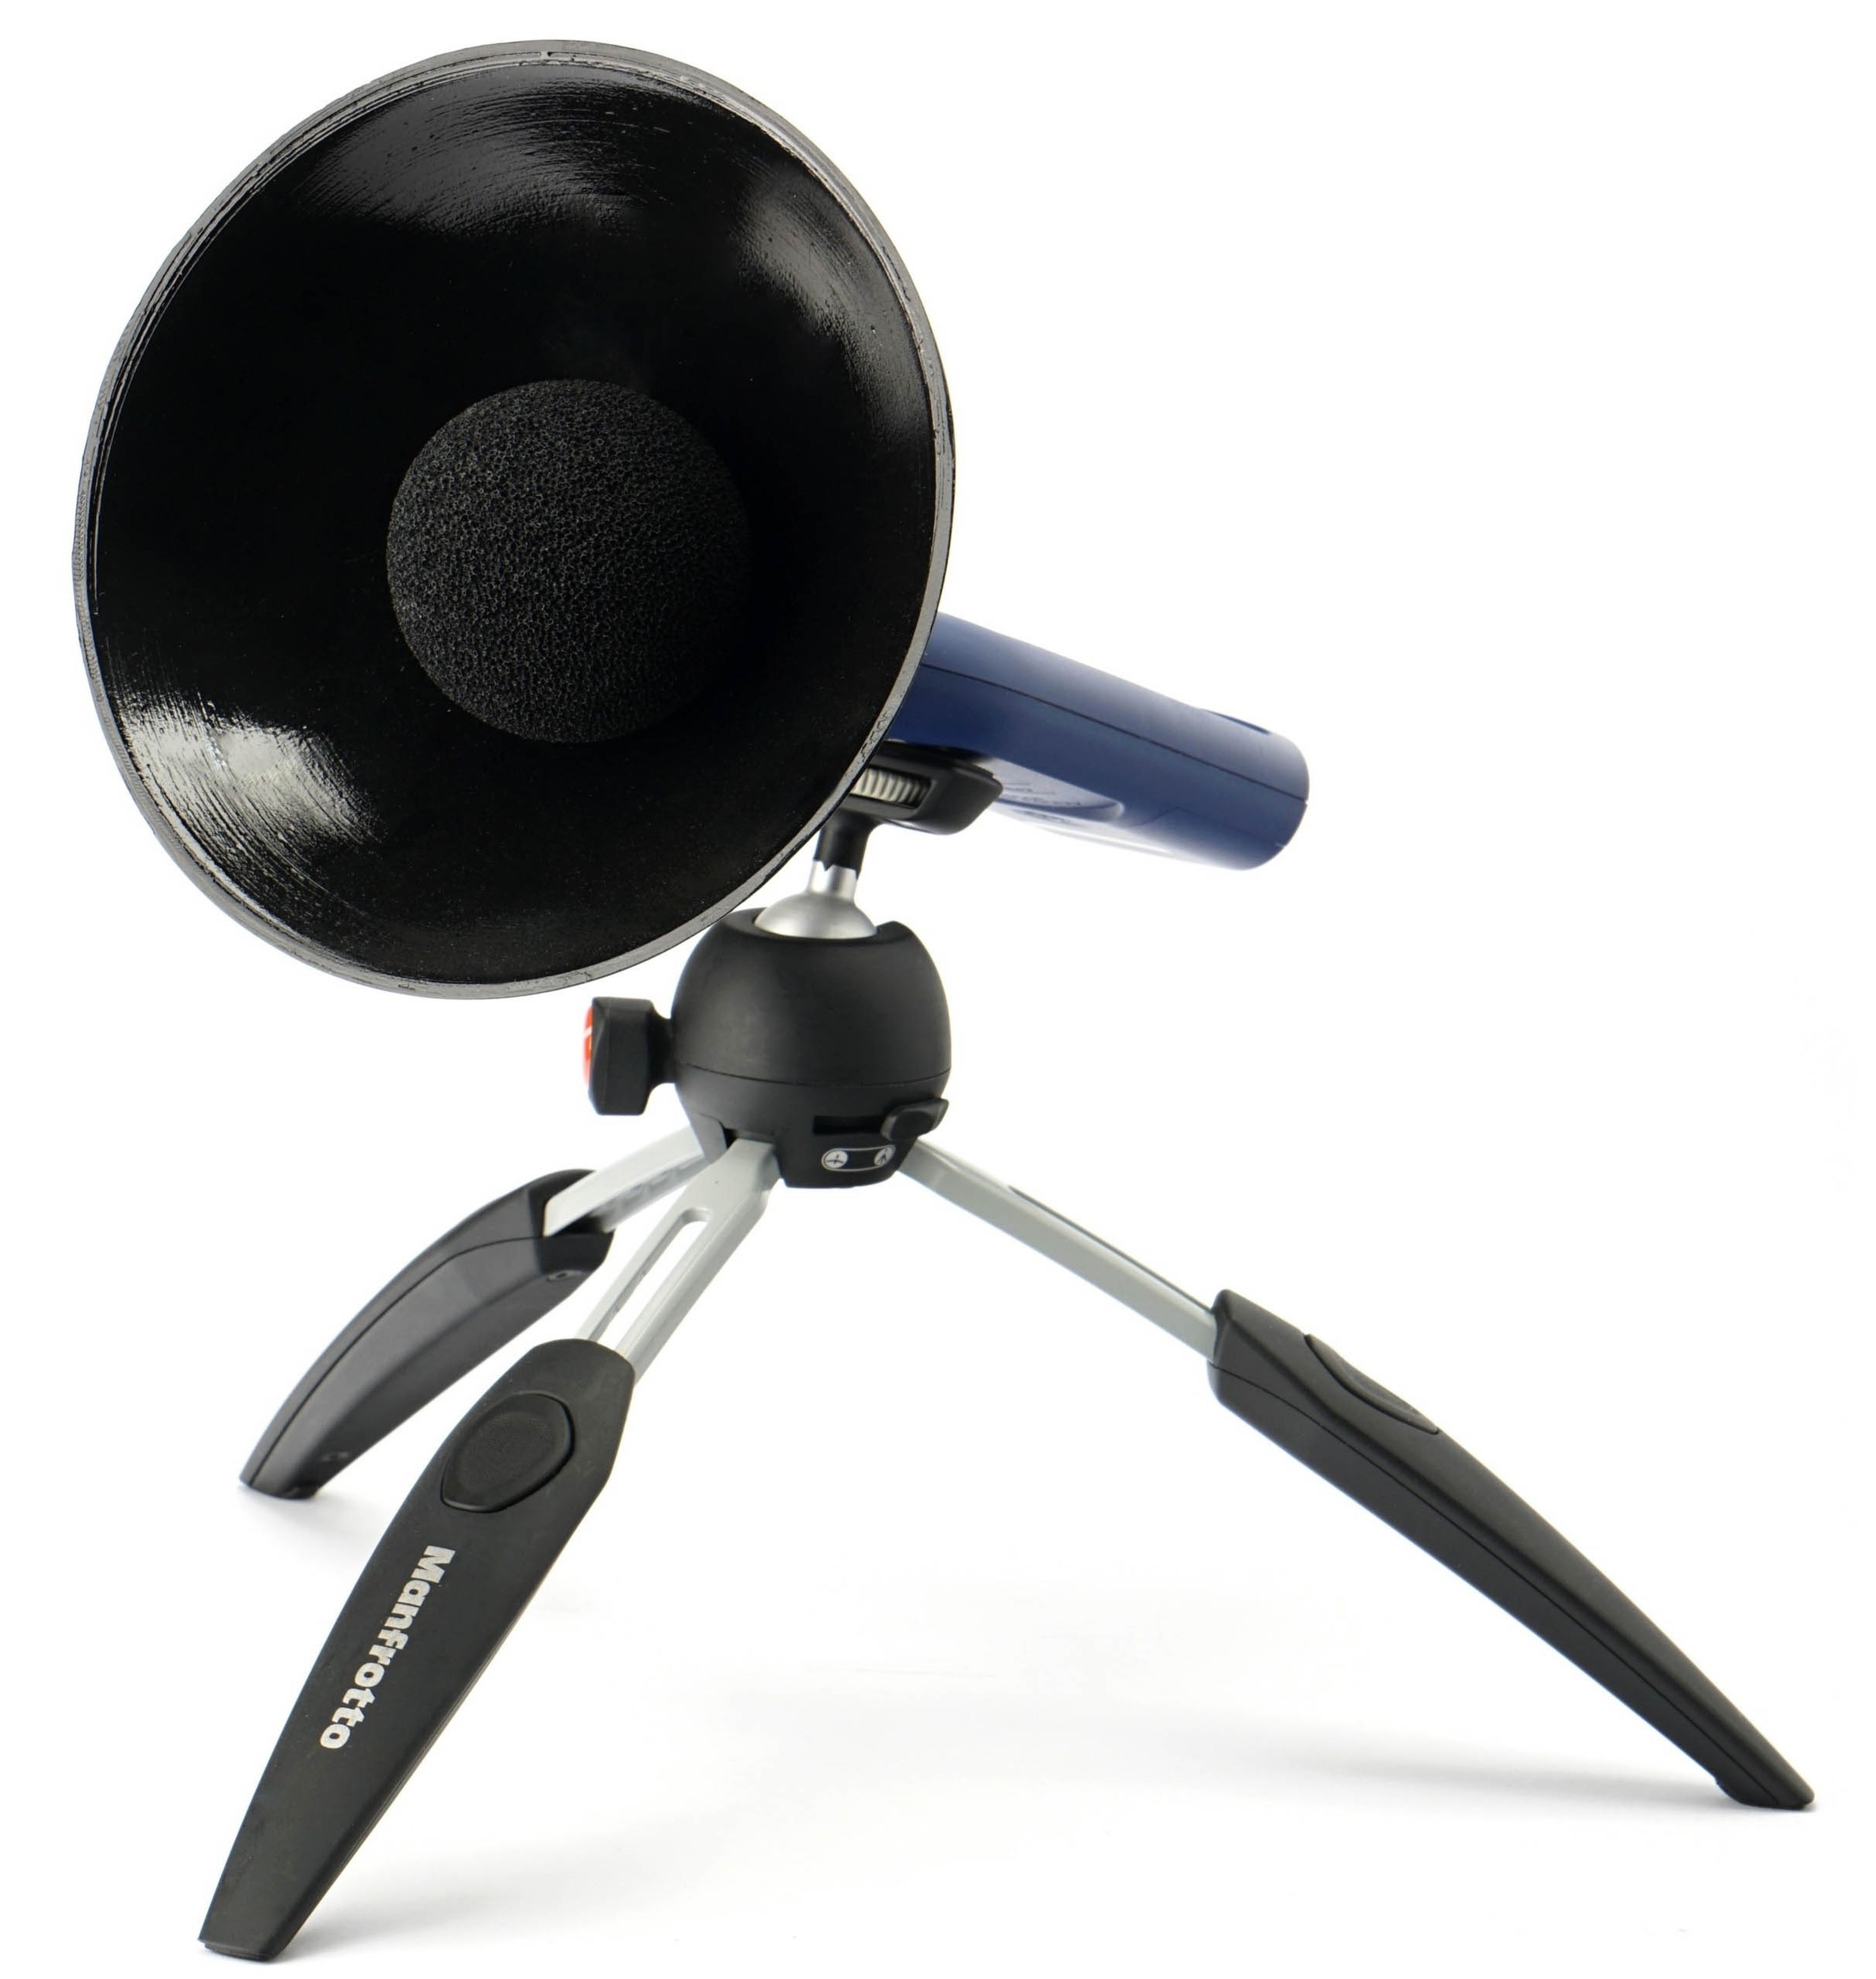
In this part of the methodology description, we will present something about the method of noise measurement. We use a Reed R8080 sound level meter, which we continuously calibrate with a calibrated Voltcraft SLC-100 digital sound level meter. A small addition to the sound level meter is a parabola-shaped collar, which has two functions. Increases the sensitivity to distinguish the sound produced even at very low speeds. It is thus possible to better compare even very quiet cards with the largest possible ratio difference. Otherwise (without this adjustment) it could simply happen that we measured the same noise level across several graphics cards, even though it would actually be a little different. This parabolic shield also makes sense because, from the outer convex side (from the back), it reflects all the parasitic sounds that everyone who really aims for accuracy of the measurements struggles with during the test. These are various cracks of the body or objects in the room during normal human activity.
To ensure the same conditions when measuring the noise level (and later also the sound), we use acoustic panels with a foam surface around the bench-wall. This is so that the sound is always reflected to the sound level meter sensor in the same way, regardless of the current situation of the objects in the test room. These panels are from three sides (top, right and left) and their purpose is to soundproof the space in which we measure the noise of graphics cards. Soundproofing means preventing different reflections of sound and oscillations of waves between flat walls. Don’t confuse it with sound-absorbing, we’ve had that solved well in the test lab for a long time.
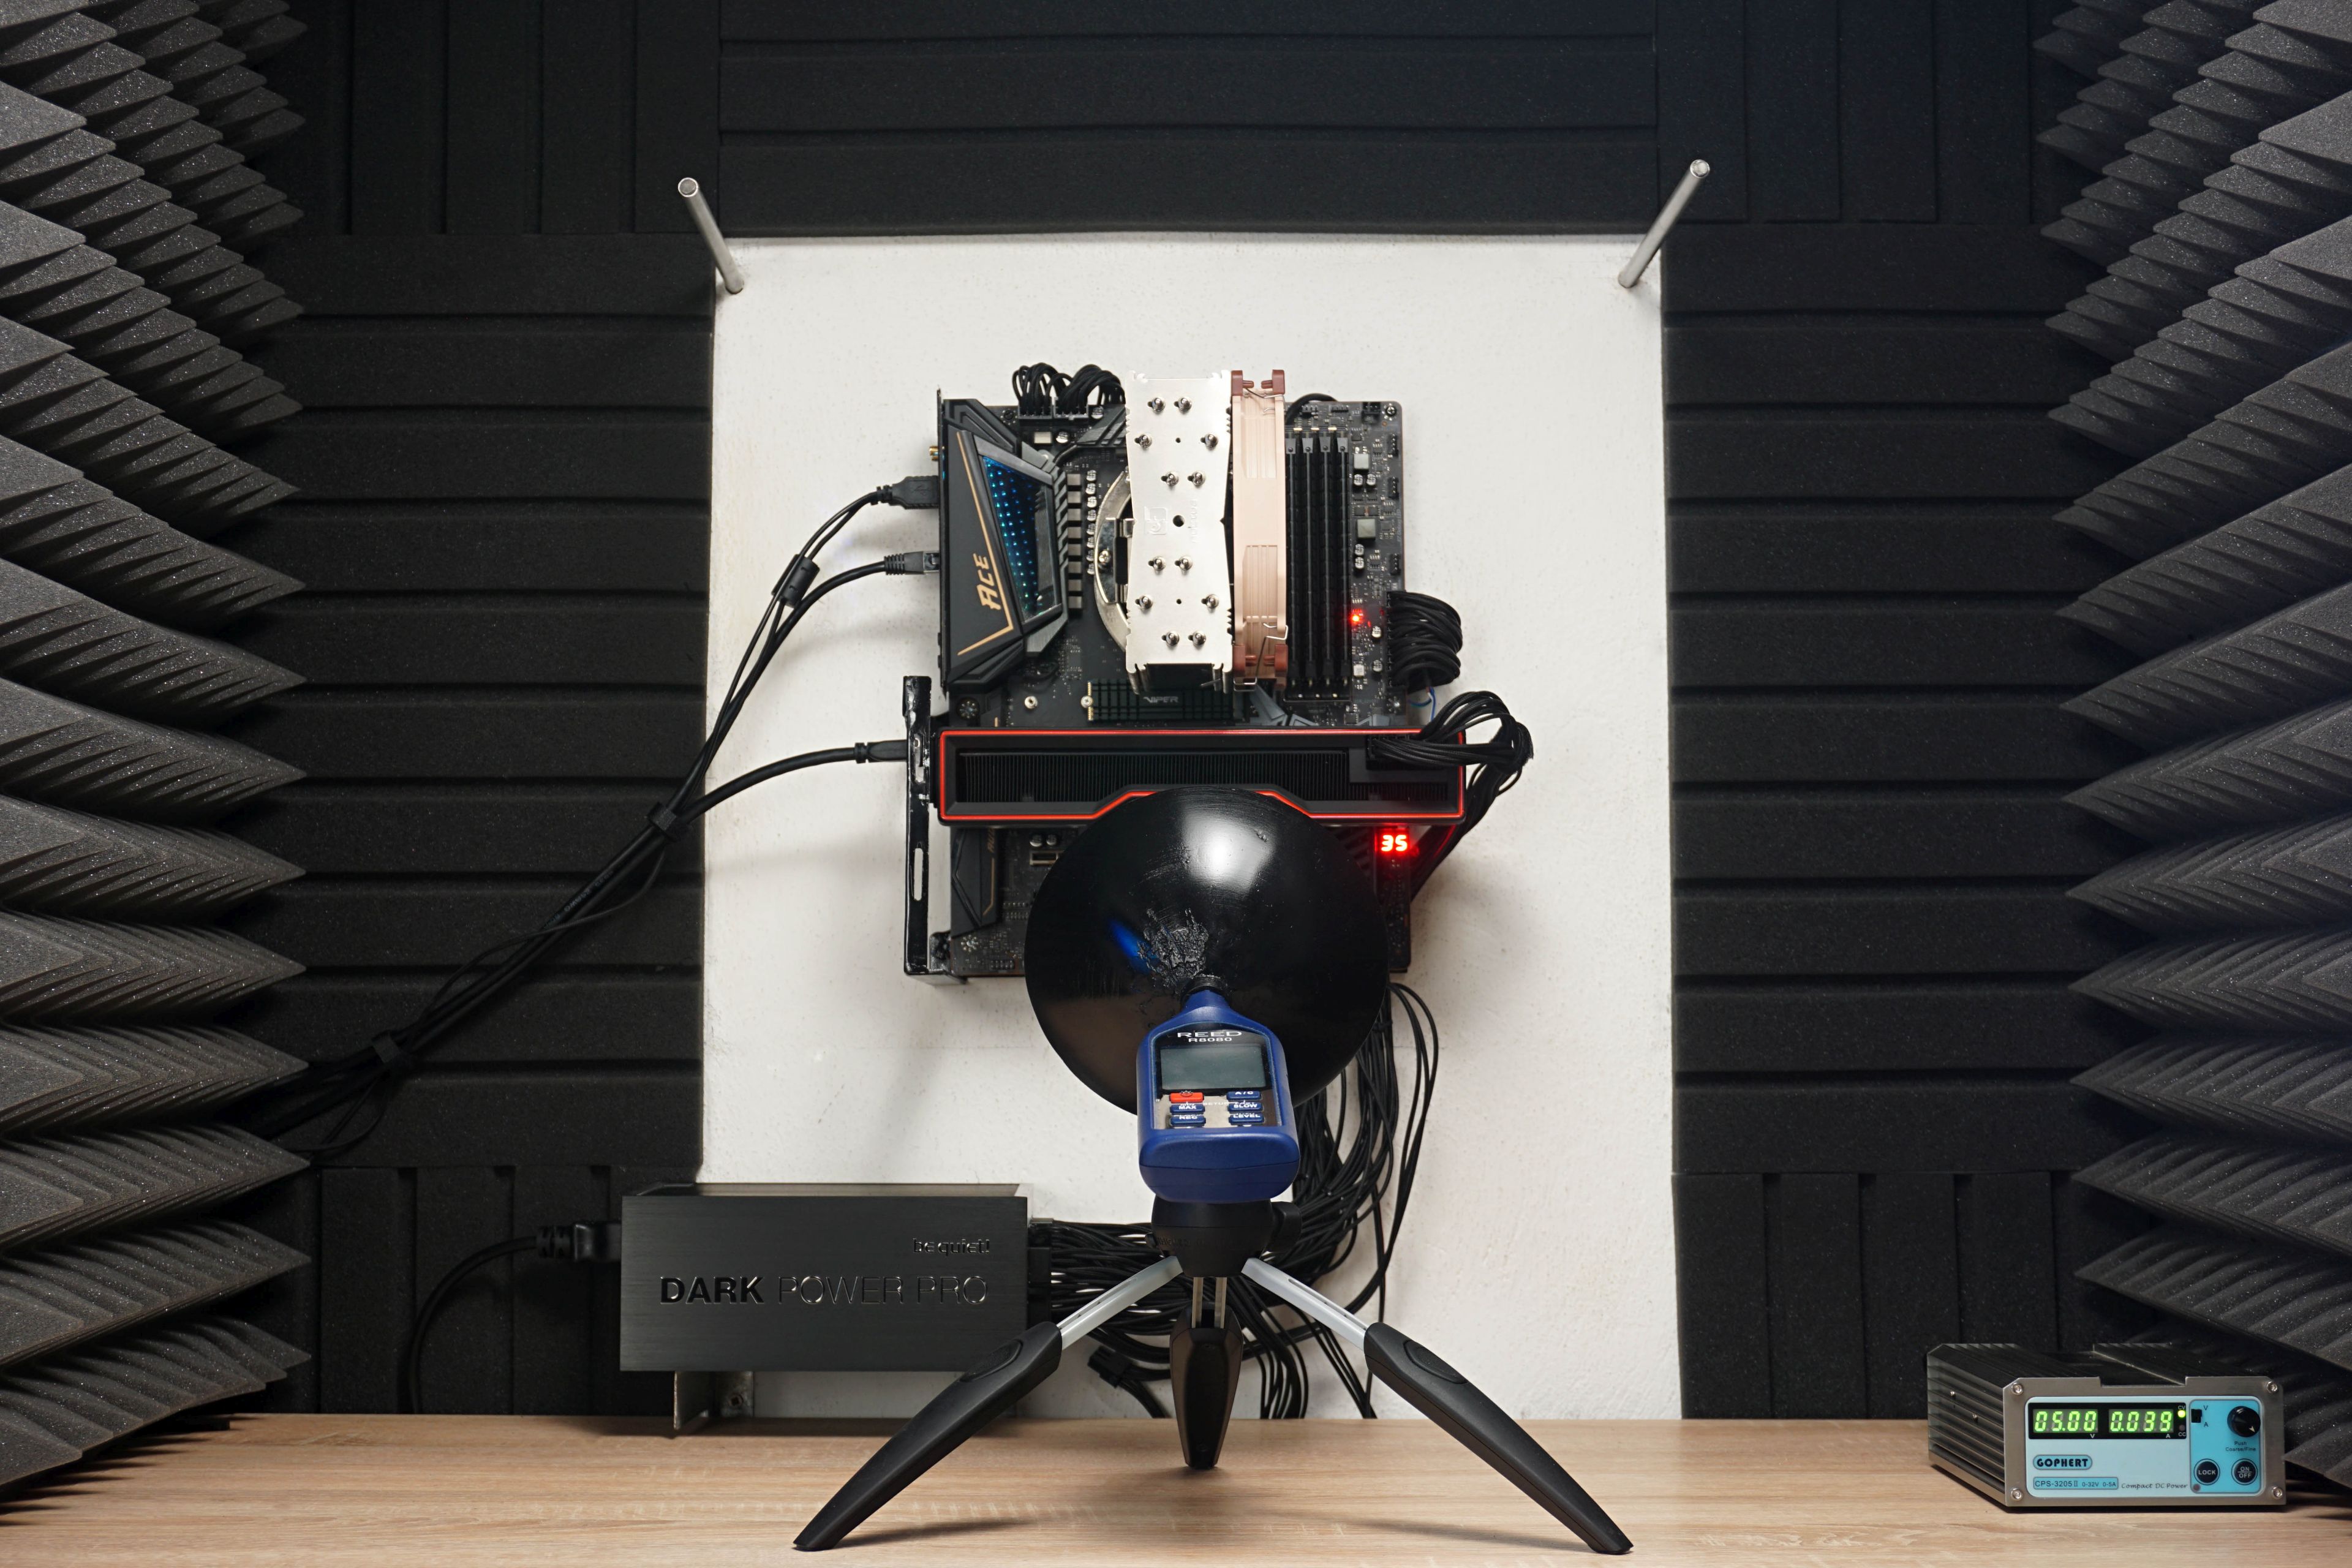
During the measurements, the sound level meter sensor is always placed on a tripod at the same angle and at the same distance (35 cm) from the PCI Express slot in which the graphics card is installed. Of course, it’s always closer to the card itself, depending on its depth. The indicated reference point and the sensor angles are fixed. In addition to the “aerodynamic noise” of the coolers, we also measure the noise level of whining coils. Then we stop the fans for a moment. And for the sake of completeness, it should be added that during sound measurements, we also switch off the power supply fan as well as the CPU cooler fan. Thus, purely the graphics card is always measured without any distortion by other components.
…and the sound frequency response
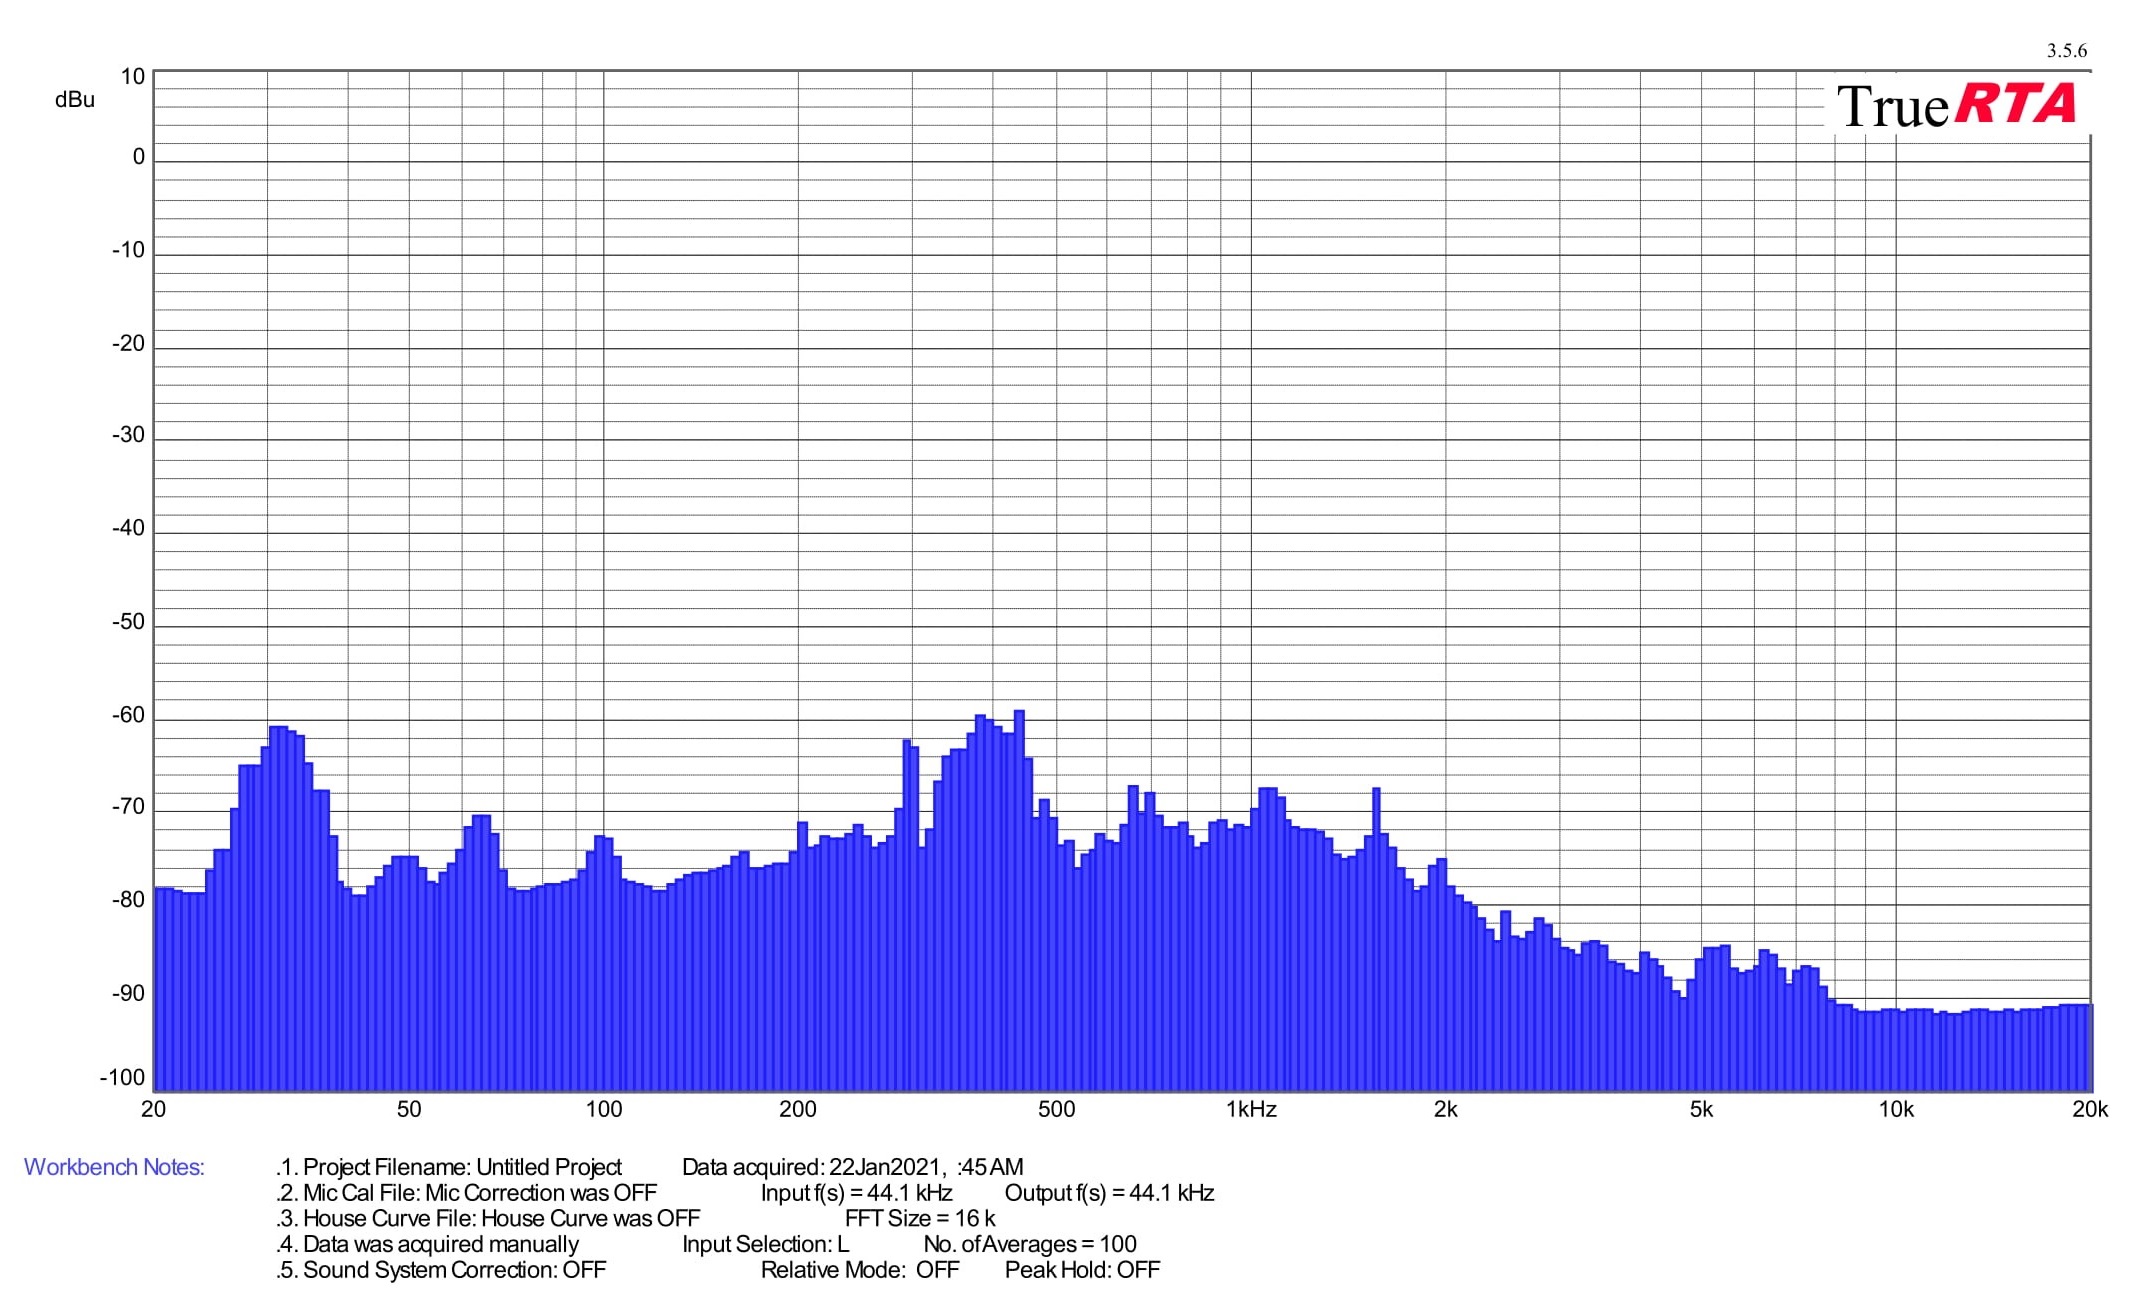
From the same place, we also measure the frequency of the sound produced. One thing is the noise level (or sound pressure level in decibels) and the other thing is its frequency response.
According to the data on the noise level, you can quickly find out whether the graphics card is quieter or noisier, or where it is on the scale, but it is still a mix of different frequencies. Thus, it does not say whether the sound produced is more booming (with a lower frequency) or squeaking (with a high frequency). The same 35 dBA can be pleasant but also unpleasant for you under certain circumstances – it depends on each individual how they perceive different frequencies. For this reason, we will also measure the frequency response of the sound graphics card in addition to the noise level, via the TrueRTA application. The results will be interpreted in the form of a spectrograph with a resolution of 1/24 octave and for better comparison with other graphics cards we will include the dominant frequency of lower (20–200 Hz), medium (201–2,000 Hz) and higher (2,001–20,000 Hz) sound spectrum into standard bar graphs. For measurements, we’re using a calibrated miniDSP UMIK-1 microphone, which accurately copies the position of the sound level meter, but also has a collar, even with the same focal length.
At the end of this chapter, it should be noted that measurements of noise and frequency response of sound will be performed on most cards only in load tests, as out of load and at lower load (including video decoding) operation is usually passive with fans turned off. On the other hand, we must also be prepared for exceptions with active operation in idle or graphics cards with dual BIOS setup, from which the more powerful one never turns off the fans and they run at least at minimum speed. Finally, as with measuring the noise level in one of the tests, we also record the frequency response of whining coils. But don’t expect any dramatic differences here. It will usually be one frequency, and the goal is rather to detect any potential anomalies. The sound of the whining coils is of course variable, depending on the scene, but we always measure in the same scene (in CS:GO@1080p).


Typical loud coil whine from Sapphire. I have a different view on the 7600 though. For me, this GPU underdelivers at 300 euros. The efficiency improvement over Navi 3 is not great. It may look OK vs insanely overclocked 6650XT, but vs 6600XT the picture will be different. It’s a mere 6nm, unlike the much more efficient 5+6nm 7900XT and XTX. When the 4060 non-Ti with identical performance (or maybe -2%) is out at 330 euros, it will be a much better buy with its 100-105W power draw in games, no crazy hotspot temps, and drivers that can be trusted. Both of them are quite bad for new titles with 8GB of VRAM and their performance is disappointing vs the last gen at the MSRP, but the 4060 can at least brag about a huge efficiency jump over the last gen. The 7600 is basically an uninspiring 6650 XT refresh in 6nm.
When it comes to gaming performance, yes the RX 7600’s efficiency is indeed equal to that of the RX 6600 XT.
To the price: It is also in my interest to have everything as cheap and high quality as possible, but I admit that I don’t understand what the problem is with RX 7600. Apart from the slightly cheaper Radeon RX 6650 XT (with many disadvantages compared to the RX 7600), the RX 7600 still has a comparable price/performance ratio. The moment the RX 6000 series ceases to exist on the market, only the RTX 4060 will be in a similar price class, which at a similar speed and at the same time significantly lower power draw will be, of course, technically more attractive, but also a more expensive option. For the casual gamer, who is more concerned with price/performance ratio than lower power draw and lower noise, there is nothing better than the RX 7600 in the end.
I don’t want to get into an opinion dispute with anyone, everyone takes different things into account when evaluating a graphics card, so we always try to test as many as possible… but the media image about how the Radeon RX 7600 is not worth it at all and how it’s garbage is far-fetched and seems really unfair to me.