


This is a first – a fan with the leading edges of the impeller blades on the opposite side to normal ones. This is primarily done for a better view of “fans without stator struts” in cases with glass side panels. In addition, such an unconventional design also has quite clear and measurable advantages and disadvantages, also in terms of functional characteristics. Let’s take everything in turn.
Initial warm-up…
Before we even start measuring anything, we let the fans run “idle” for a few minutes after plugging them in. This is because immediately after a cold start the fans reach different parameters than after a certain amount of short-term operation.
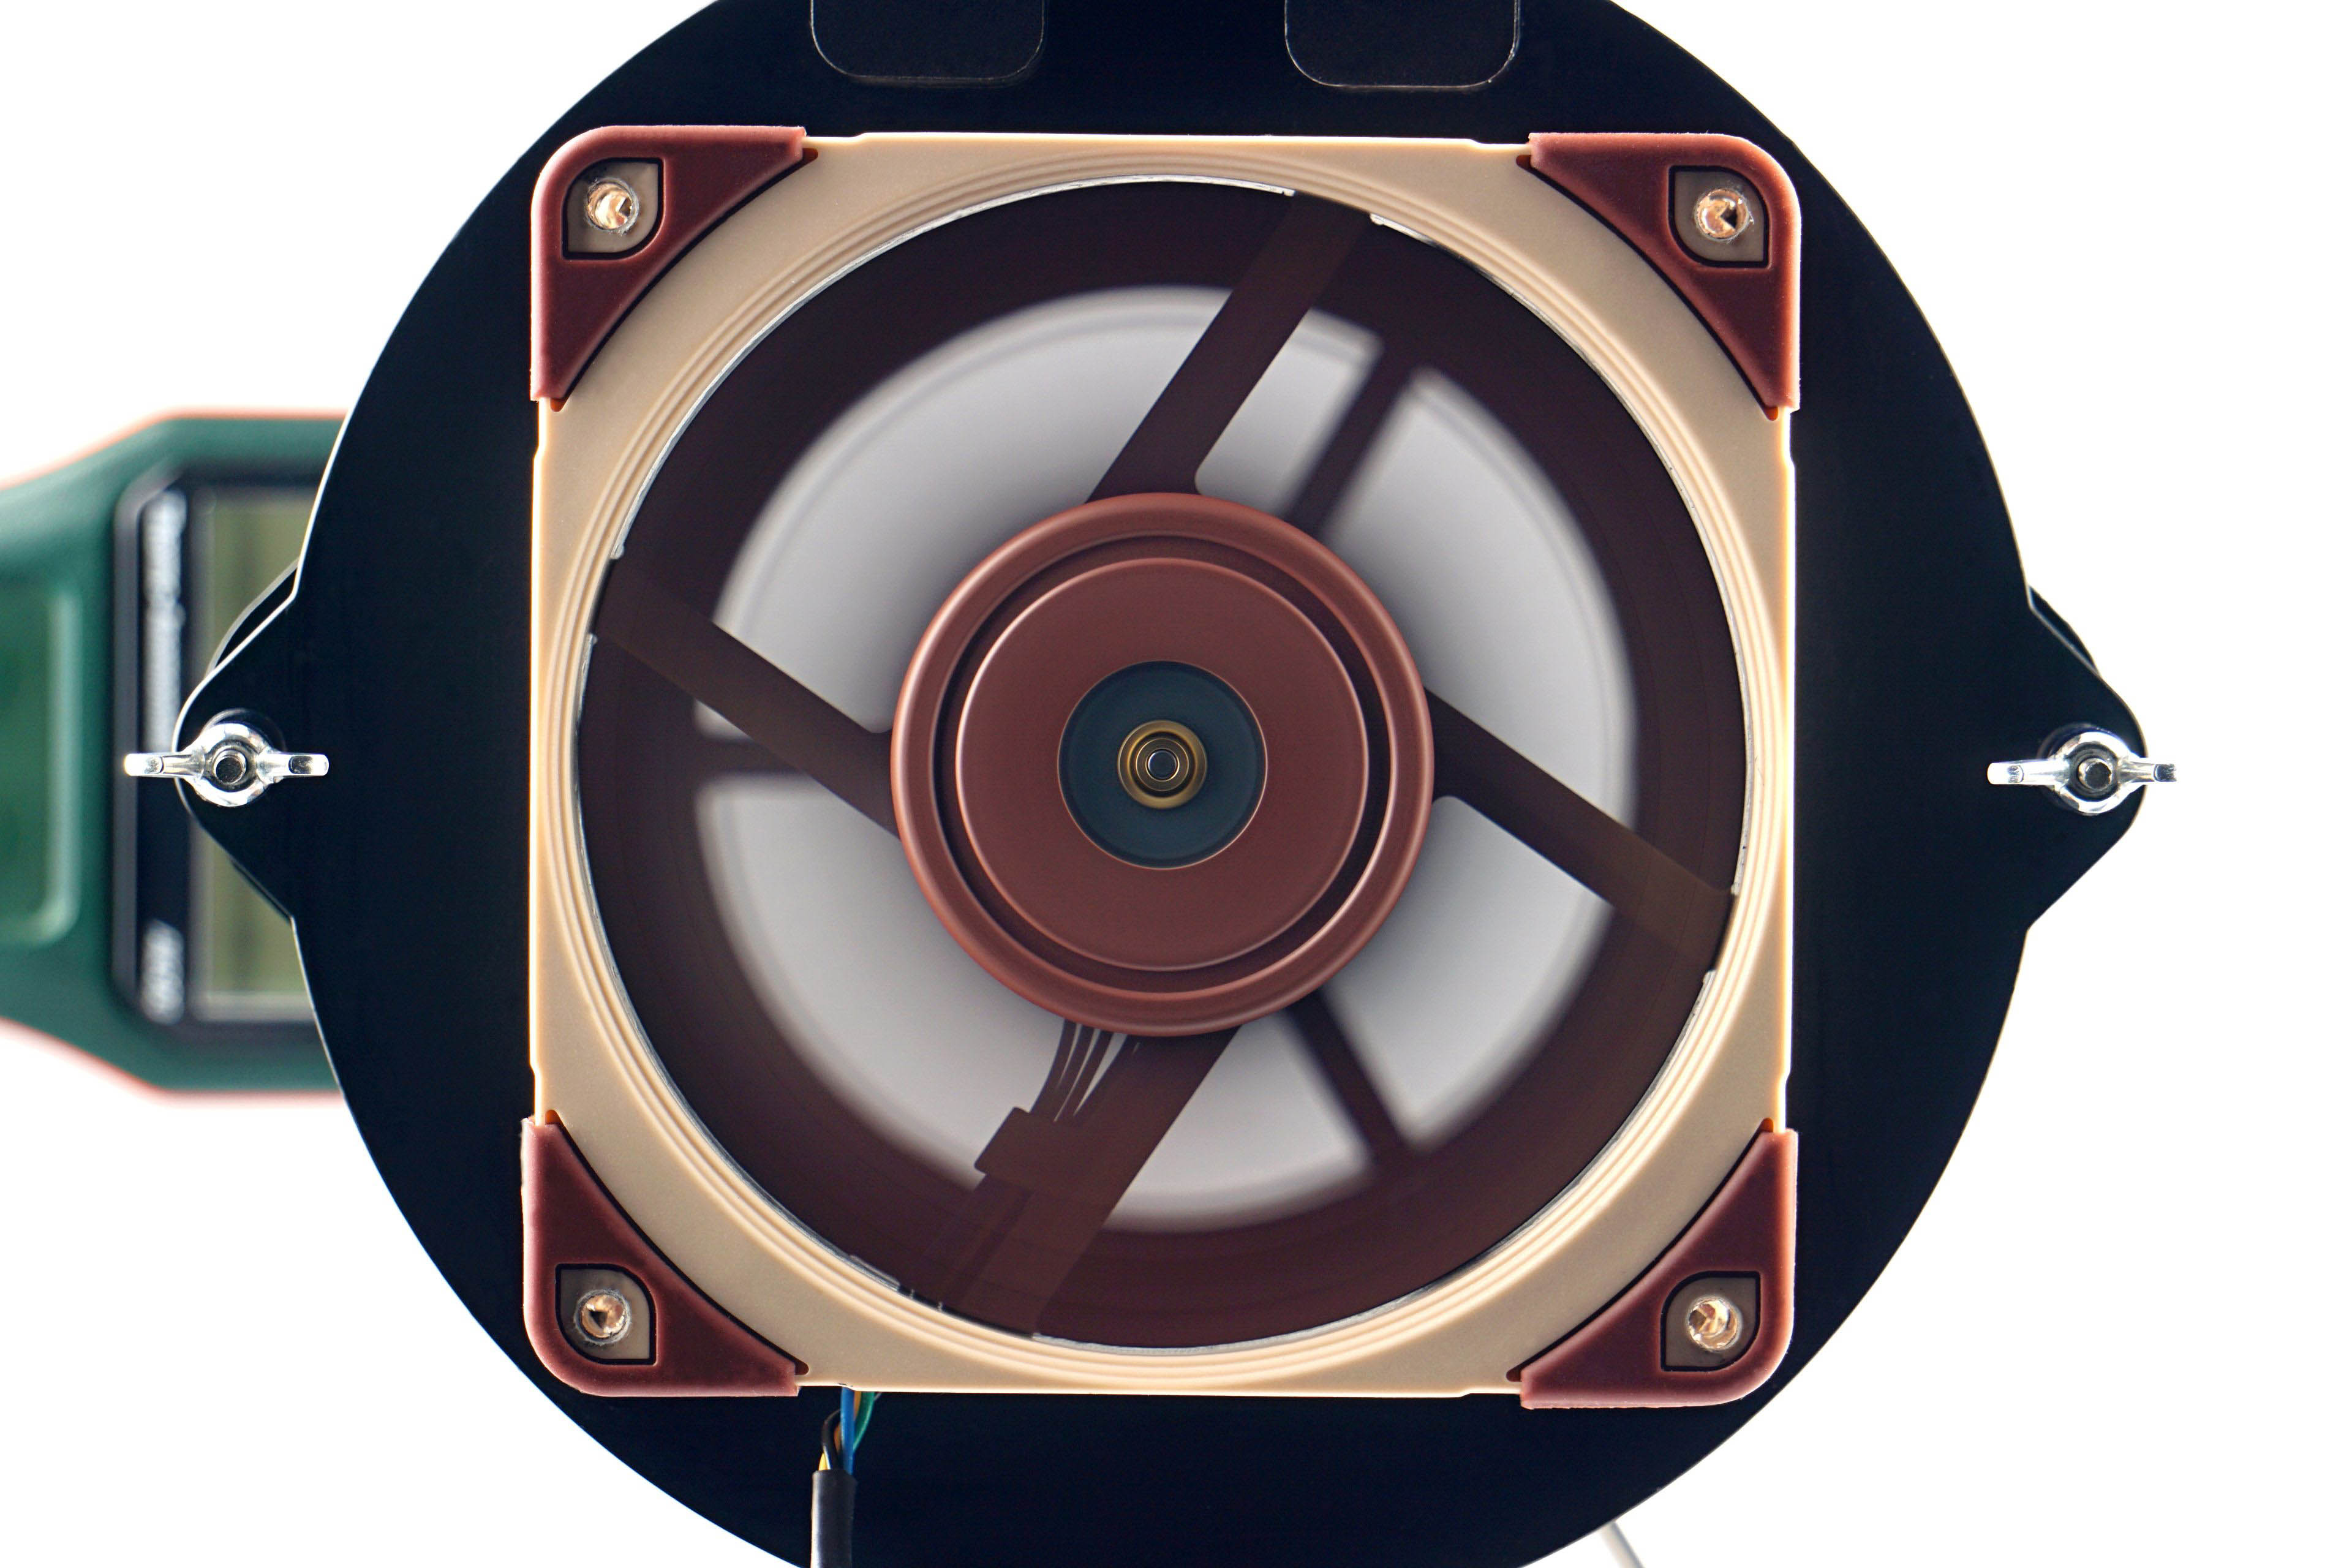
Until the operating temperature of the lubricant is stabilized, a typically lower maximum performance is achieved. This is because at lower temperatures the lubricant is denser, which is associated with higher friction. Therefore, the fans do not reach maximum speed immediately, but only after the first few seconds. Before the first measurements, we therefore leave the fans running for at least 300 seconds at 12 V, or 100 % PWM intensity.
… and speed recording
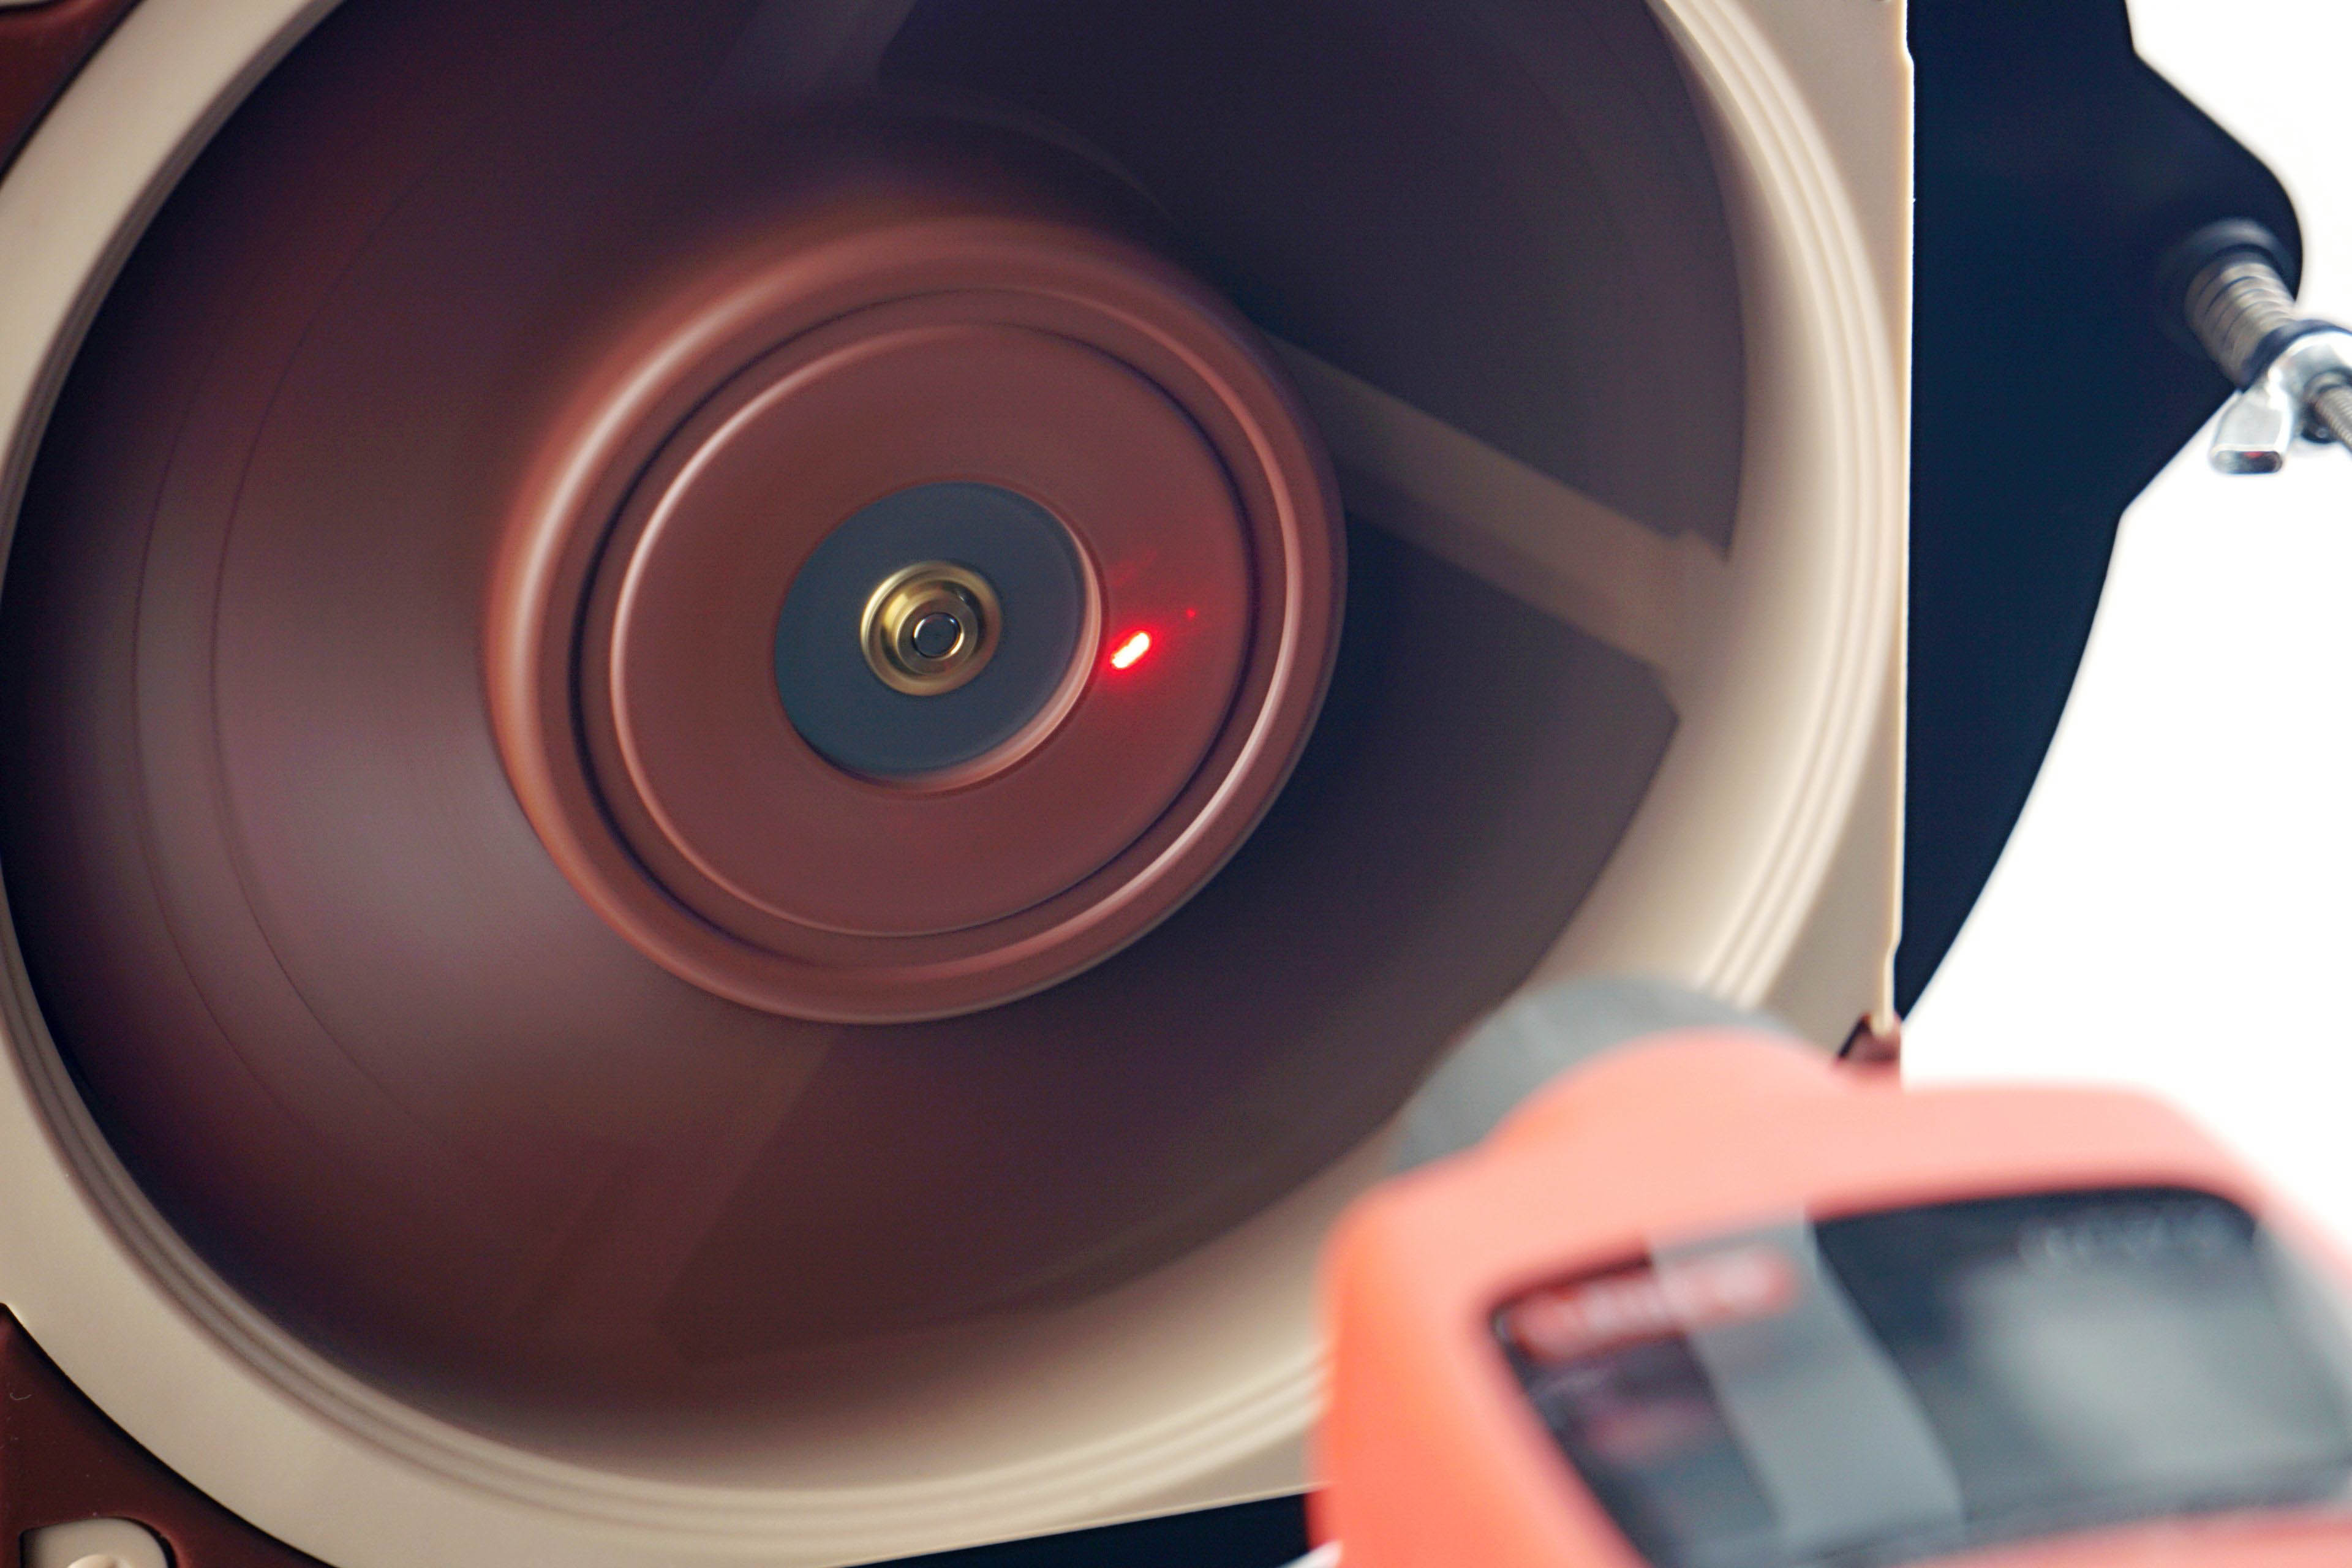
The speed of the fans is monitored using a laser tachometer, which reads the number of revolutions from a reflective sticker on the impeller. For this purpose, we use the UNI-T UT372 device, which also allows real-time averaging of samples. Thus, we do not record the peak value in the graphs, but the average speed value from a 30-second time period.
However, the speed itself is a relatively unimportant parameter that is often given more attention than is appropriate. This is the case even in many fan or cooler tests, where speed is used to normalize the different modes in which other variables are measured.
However, hyper-focusing on a specific speed is a rather unfortunate decision if only because the fans don’t gain any commonality. At the same speed all other variables are different, there is no intersection. It can be noted that a better normalization would have been by any other variable, whether it be static pressure, flow or noise level, which wins in our case. But more on that in the next chapter.
We only measure the speed so that you can associate a particular parameter (such as the amount of static pressure or some noise level) with something according to which you can adjust the fan yourself. Perhaps for that alone, the information about the achieved speed is useful. As part of the fan analysis, we will also indicate what the fans’ starting and minimum speeds are. Start-up speeds tend to be higher than minimum speeds because more force is required to get the impeller moving than once the fan impeller is spinning, and a minimum power intensity is sought at which the fan does not stall.




Any plans for tests of the non-reverse variant, and also spacers (like Noctua NA-IS1)? To me they would be the logical next steps for topics raised in this test.
We do not plan to test the standard variants of TR120 fans in the near future. In the long run, the basic plan remains the same – we have to compare all the fans that exist, haha. Only time will tell where we will really end up. 🙂
We’ve had the NA-IS1 frames in our editorial office since their introduction. Of course it would be really useful to get to them and one day it will come. I still can’t make space for them – there is always something “more important”.
Always looking forward to your tests, whatever they are🙂
One additional question though, could you further elaborate what’s going on with the hexagonal grille tests for this fan? First time I’ve seen a fan that somehow has parts of the data missing in the middle (33 and 36 missing, but not 31 and 39). You say unstable tonal peaks, so is the RPM unstable at those noise levels, or is it due to something else?
I think it’s happened before. But maybe it was for the quietest or loudest mode of normalised noise and then it can be attributed to another reason? Anyway, I will explain.
It is important to realize how we bring the fans to the “same noise level”. It’s not like we set the fan somehow and it’s stable at, say, 36 dBA. It’s that we set the fan so that the average of 30 samples ends up at 36 dBA. The interval of these samples can be in the range of 35,9–36,1 dBA during the measurements, for example, but possibly also in a much wider range, for example 32–38 dBA, and now I am not exaggerating. This latter case is similar to trying to get the TR120 into the 33 and 36 dBA modes, which failed. With no PWM setting (nor after very fine tuning of the pulse strength with voltage in single digits of mV), we could not set the fan on the grille so that the average of 30 samples corresponds to 33 dBA and 36 dBA, respectively. It was always more or less, i.e. not what was required. This is a topic that certainly makes sense to look at in more detail. Especially after Noctua opened this “Beat frequency theory” topic, which is a good basis for understanding the issue by a wider than very narrow spectrum of users.
–“Beat frequency theory”
…well, already during the 1st world war the company on the bridge had to stop marching in order not to shake the bridge.
Wave interferance
https://en.m.wikipedia.org/wiki/Wave_interference
In acoustic
https://en.m.wikipedia.org/wiki/Beat_(acoustics)
Thanks for your detailed explanation. The only other time I have heard the need of averaging noise samples is from ThermalLeft. What’s the sampling rate you’re using?
This phenomenon is definitely worth looking into some day, especially for instances like this where large deviations occur.
The sampling rate of the Reed R8080 is 1s. The settings for the individual modes normalized according to a fixed noise level are based on the arithmetic mean of a 30-second recording. This must always be exactly 31.0; 33.0; 36.0; 39.0; 42.0 or 45.0 dBA after rounding.