


Gigabyte has put together a fan that combines ARGB LEDs, clever daisy chaining using connectors in the frame, and very good results on radiators. All of that for an attractive price. The design of the Aorus EZ Chain Fan 120 Ice seems to be optimized for use on radiators in particular. In fact, these are the cheapest ARGB fans with daisy chaining and this kind of efficiency that we’ve ever tested.
Basis of the methodology, the wind tunnel
Before you start reading the methodology with all the details, take a look at the test tunnel as a whole. This is the heart of the whole system, to which other arteries are connected (manometer, vibrometer, powermeter, …). The only solid part of the tunnel from the measuring instruments is the anemometer.
The shape of the wind tunnel is inspired by the Venturi tube, which has long been used to measure the flow of liquids and gasses. The Venturi effect for wind speed measuring is also known from the aerospace industry. However, the design for measuring computer fans has its own specificities, which this proposal of ours reflects.
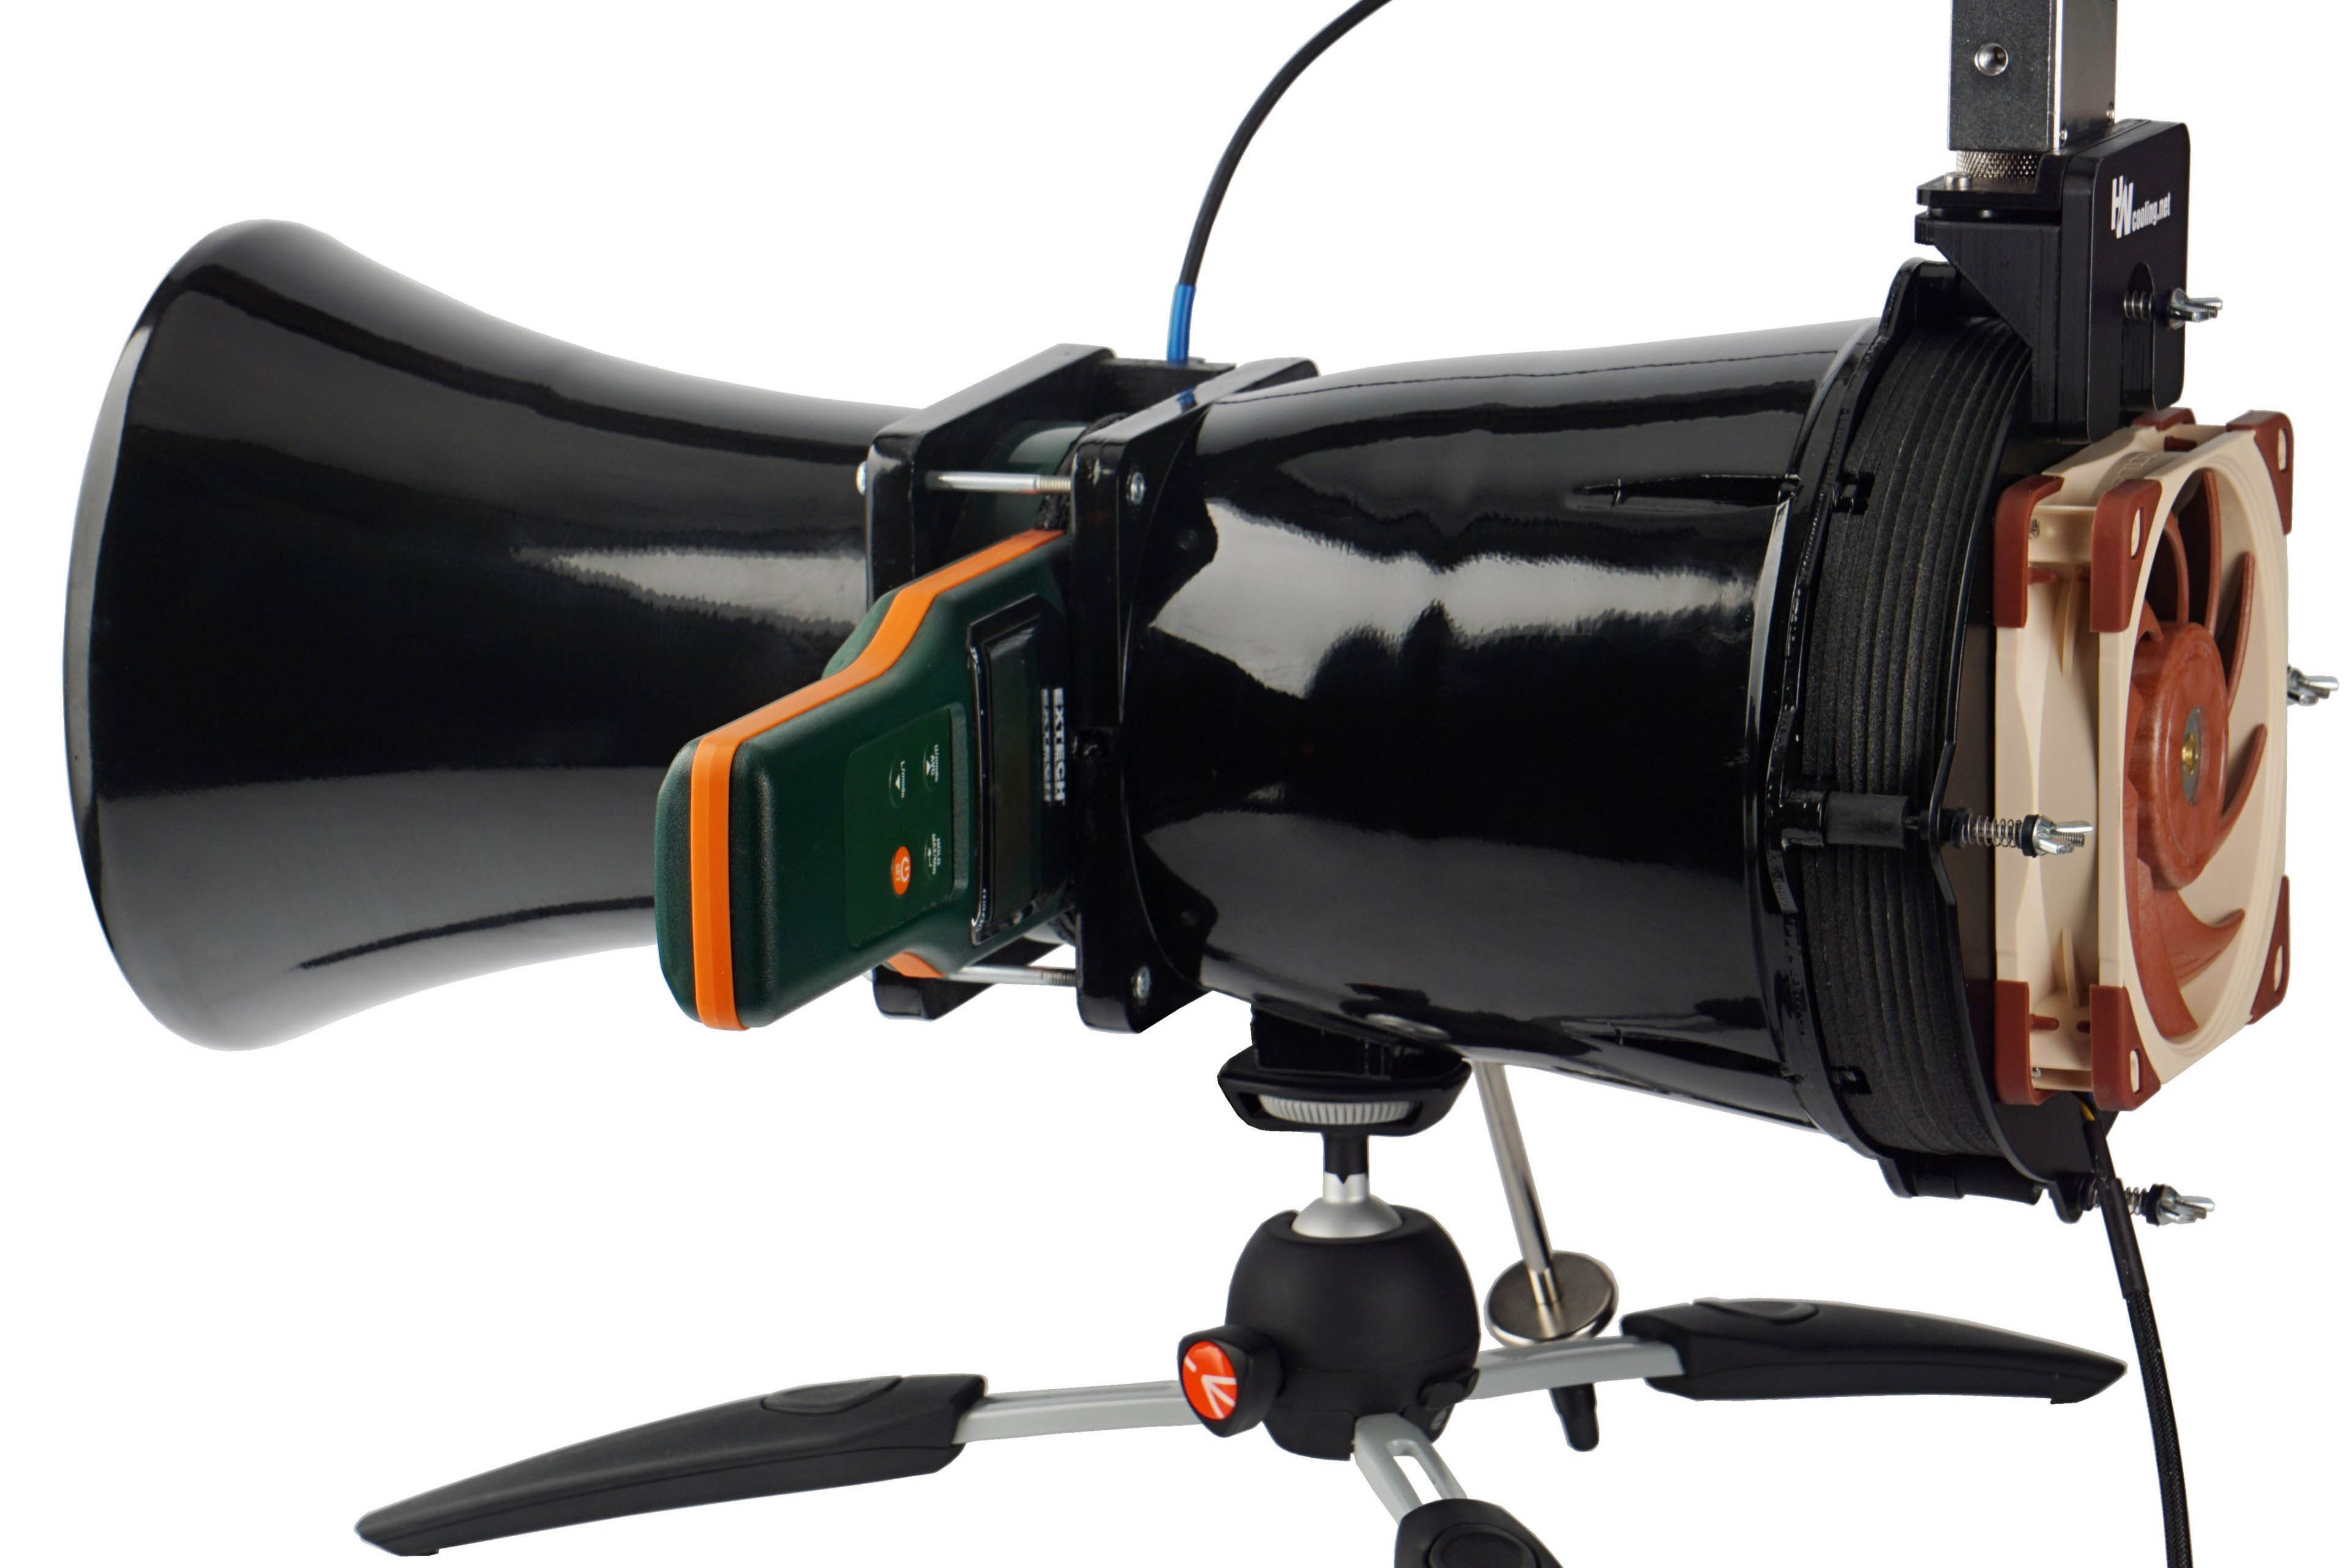
The individual parameters of the HWC wind tunnel for fan tests are the result of physical simulations and practical debugging. All the details (folds, material or finish used) have a rationale behind them and are designed this way for a specific reason. We will discuss the individual design details in turn in the description of the sub-variable measurements.
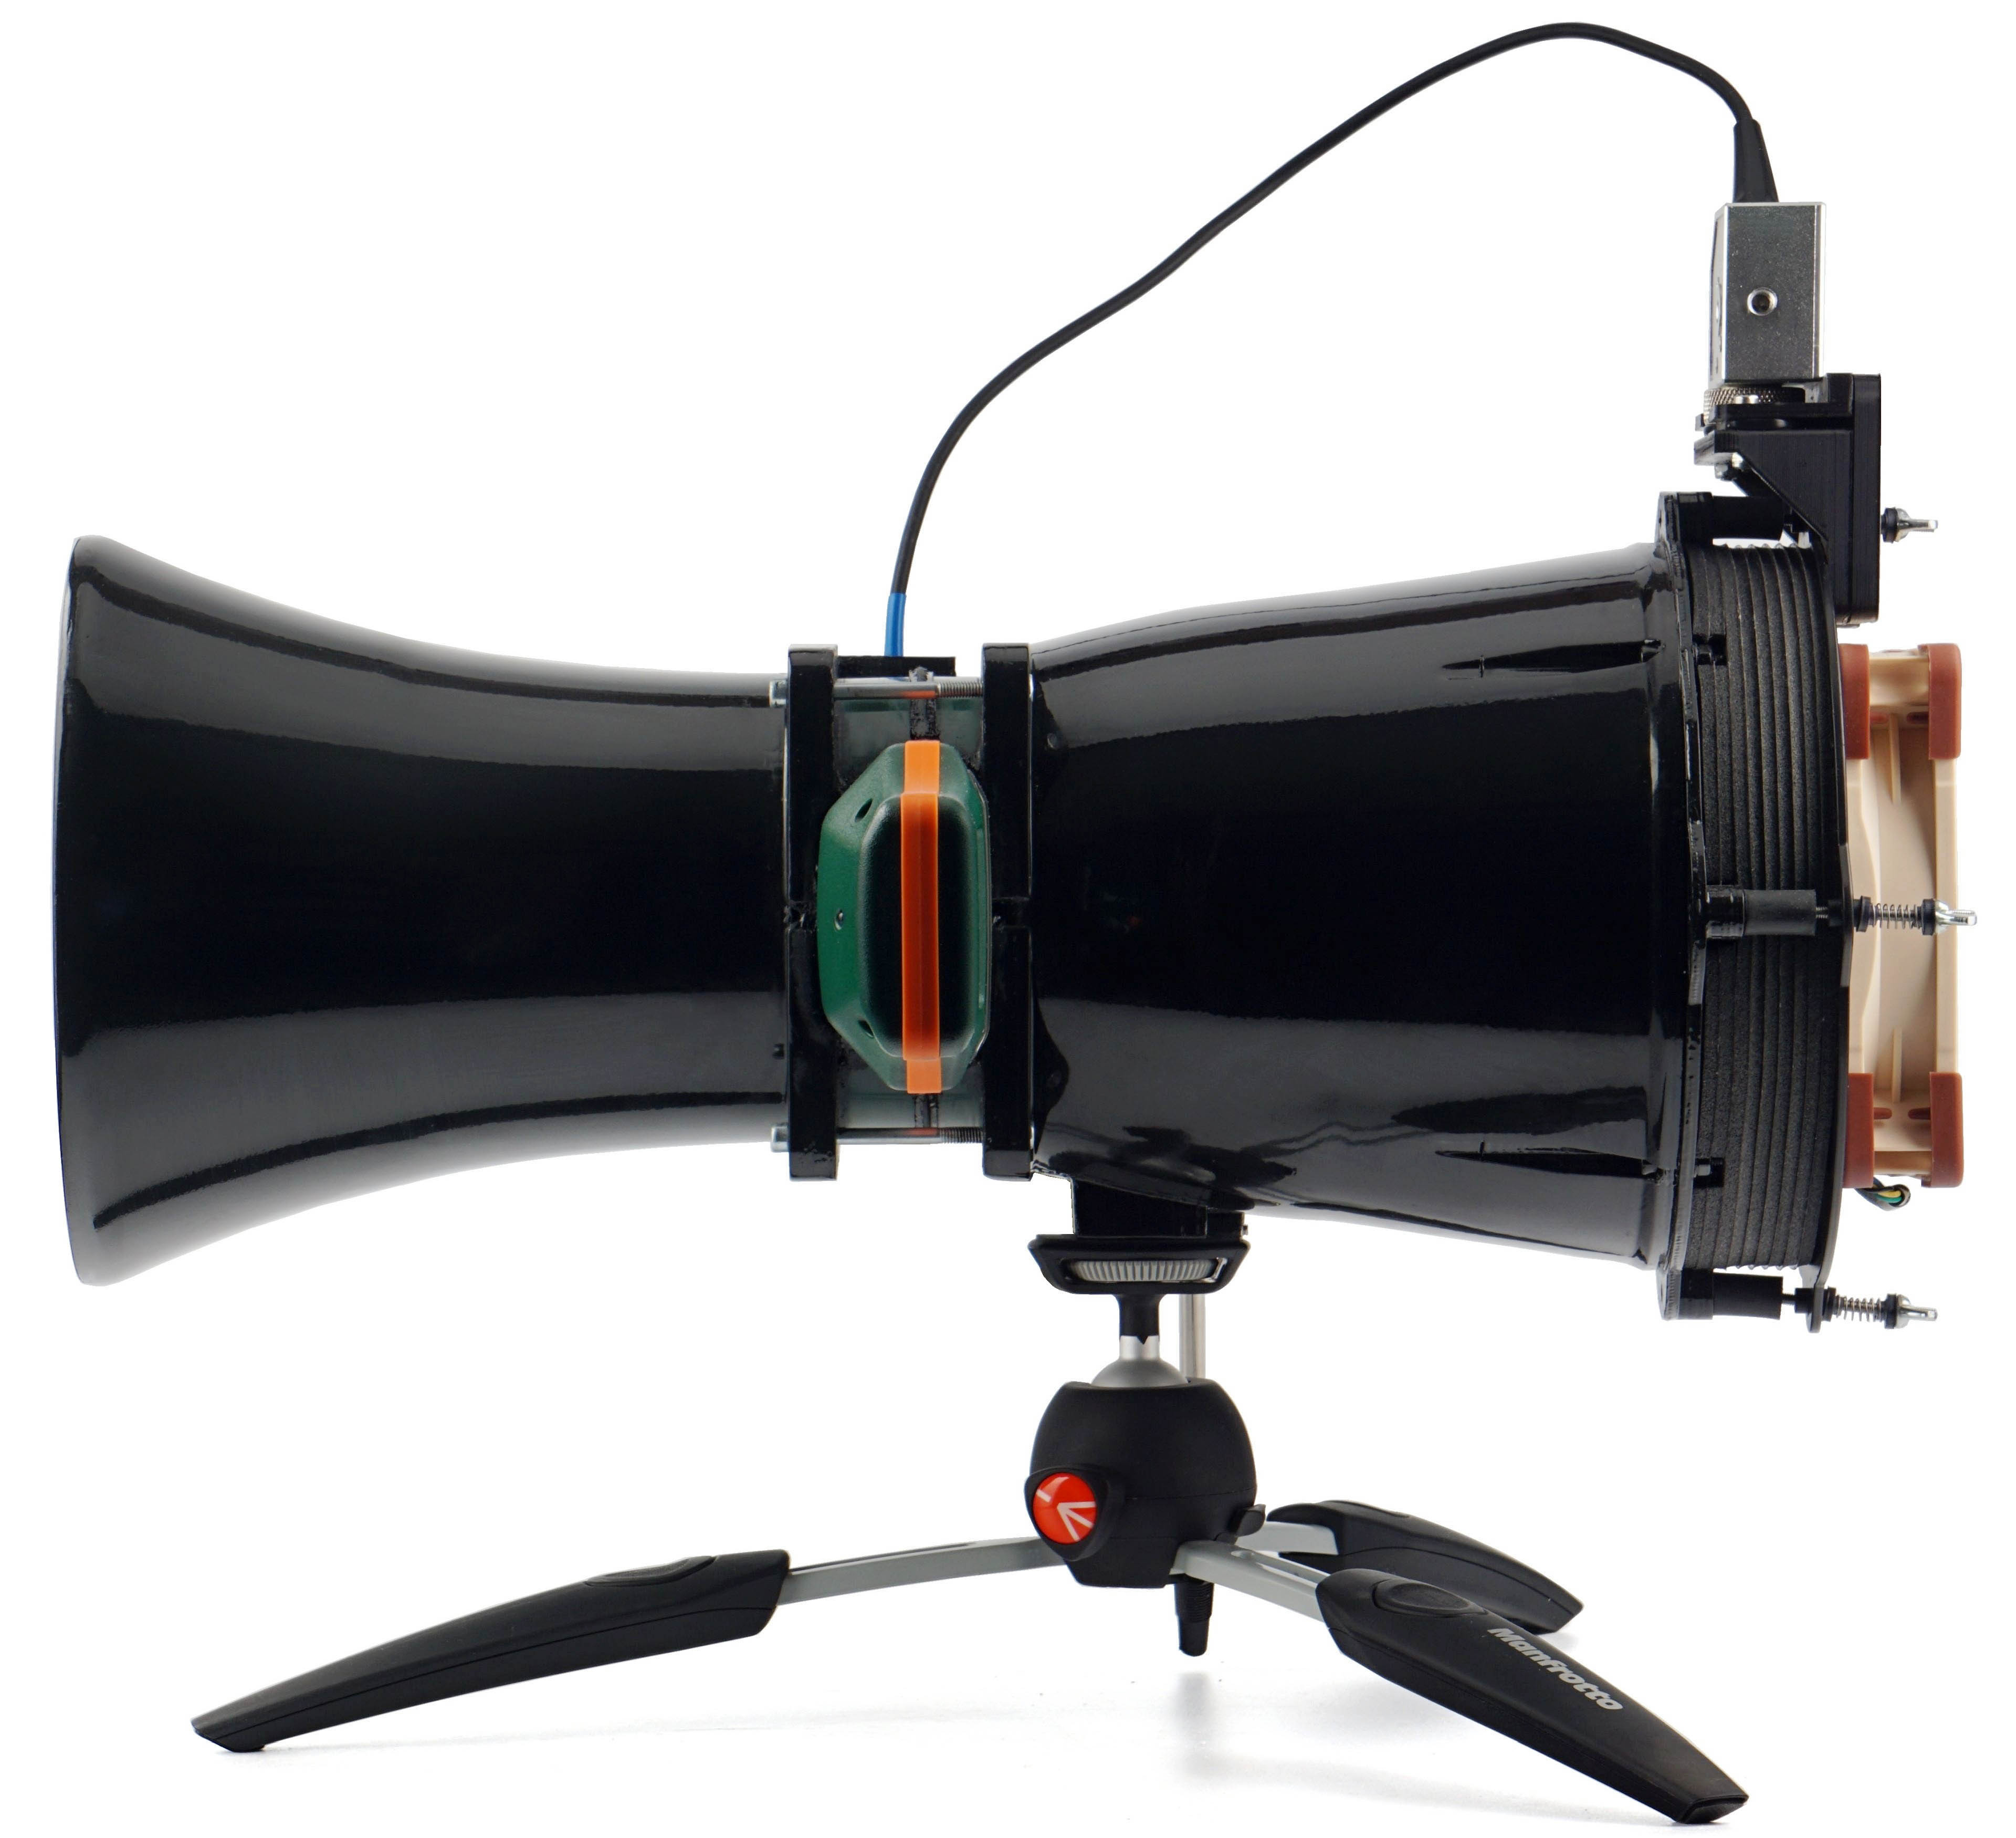
Now we will briefly elaborate on some things that do not fit thematically into the text of the following chapters. Namely, for example, that the skeleton of the wind tunnel is the work of a 3D printer (PLA). The rough print was, of course, then thoroughly machined by grinding, fusing, polishing and varnishing. Especially important is the smooth finish of the interior walls.
When joining the individual parts, the emphasis was on making sure that they fit together flawlessly, that they were sealed flawlessly (we will come back to this when we describe the test procedures for pressure measurement), but also that the joints were not loosened by use. Everything is disassemblable for servicing purposes, but it is ensured that the properties are maintained during use and, for example, even under the stress of vibration. The threads are secured with either lock nuts or thread-locking fluid. It depends on which is more suitable in which place.
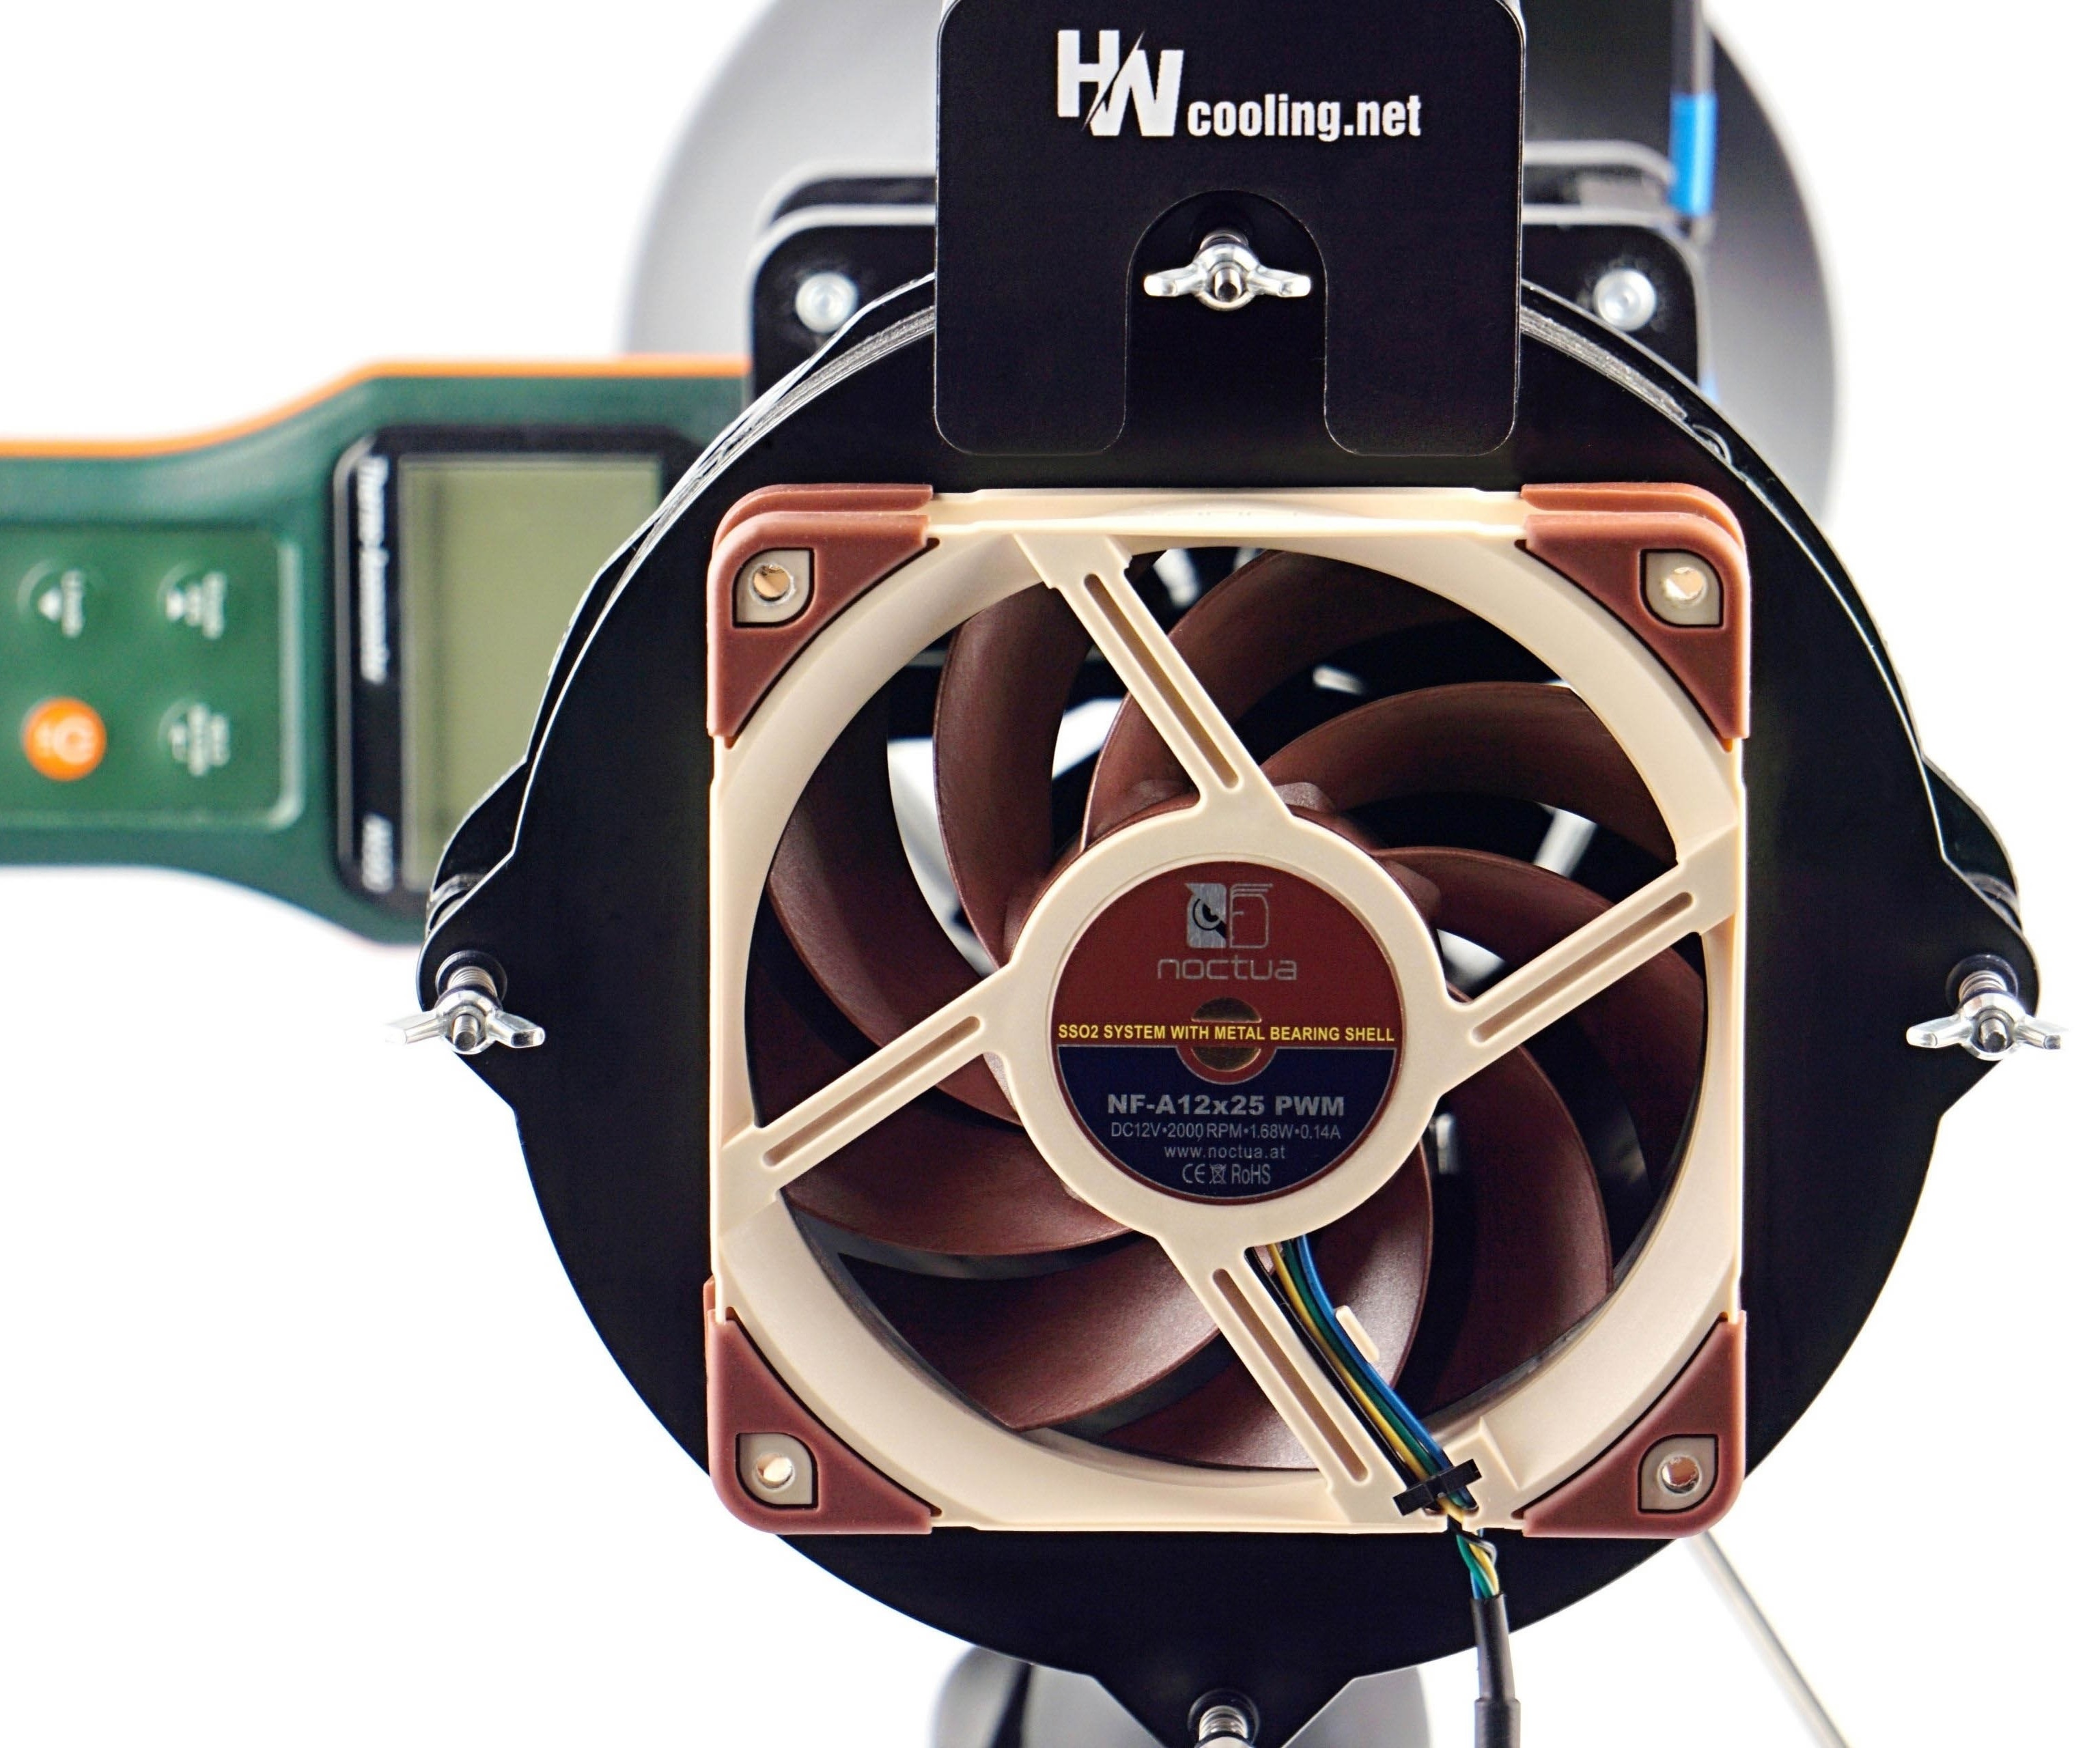
When the wind tunnel is not in use, it is enclosed in a dust-tight chamber. In addition to the technical equipment and its correct storage, it is also important for objective outputs that all measuring instruments are calibrated according to the standard. Without this, it would be impossible to stand behind your results and rely on the manufacturers’ specifications. Calibration protocols are therefore an important part of the methodology. Testing is carried out at an ambient air temperature of 21–21.3 °C, humidity is approximately 45 % (± 2 %).
Fans come to us for testing in at least two pieces of the same model. If the deviations of any of the measured values are greater than 5 %, we also work with a third or fourth sample and the average value is formed by the results of the fans that came out the most similar and the differences between them fit under 5 %.






While I understand the need to trim down the length of the charts, I miss being able to directly compare between 120 and 140 mm fans in one chart.
Perhaps an article can be made that updates every time a new fan review is posted, that includes all up-to-date charts for all fan formats? This will also make sharing the fan test results easier – the link will always lead to the latest data. Well, at least it would be the stop-gap solution before a proper database is created. Alternatively, add a filter option into the charts that let you toggle some data on or off, though I am not sure how feasible it is.
Another suggestion is to embed the links to the reviews of each fan into the charts themselves.
Thank you for your feedback on this matter. 🙂
We thought about how to do it and whether to do it at all – the separation of 120 mm from 140 mm format fans. In the end, we approached it like this, and maybe it would be a good compromise to release at some intervals (always at the end of the year) a complete database of the results, where both formats are included in one graph?
You have some good ideas about filtering, but here we encounter the limited possibilities of the interactive graphs we use. They are very outdated in their core and while it would be useful to completely rewrite (and modernize) them, unfortunately we don’t have the capacity to do that at the moment.