


Gigabyte has put together a fan that combines ARGB LEDs, clever daisy chaining using connectors in the frame, and very good results on radiators. All of that for an attractive price. The design of the Aorus EZ Chain Fan 120 Ice seems to be optimized for use on radiators in particular. In fact, these are the cheapest ARGB fans with daisy chaining and this kind of efficiency that we’ve ever tested.
33 dBA or 33 dBA
The noise level, given as a single dBA value, is good for quick reference, but it doesn’t give you an idea of exactly what the sound sounds like. That’s because it averages a mix of noise levels of all frequencies of sound. One fan may disturb you more than the other, even though they both reach exactly the same dBA, yet each is characterized by different dominant (louder) frequencies. To analyze thoroughly with an idea of the “color” of the sound, it is essential to record and assess noise levels across the entire spectrum of frequencies that we perceive.

We already do this in graphics card tests, and we’ll do it for fans too, where it makes even more sense. Using the UMIK-1 miniDSP microphone and TrueRTA’s mode-specific, fixed dBA application, we also measure which frequencies contribute more and which contribute less to the sound. The monitored frequency range is 20-20,000 Hz, which we’ll work with at a fine resolution of 1/24 octave. In it, noise levels from 20 Hz to 20 000 Hz are captured at up to 240 frequencies.
The information captured in the spectrograph is a bit more than we will need for clear fan comparisons. While you’ll always find a complete spectrograph in the tests, we’ll only work with the dominant frequencies (and their noise intensities) in the low, mid, and high bands in the comparison tables and charts. The low frequency band is represented by 20–200 Hz, the medium by 201–2000 Hz and the high by 2001–20 000 Hz. From each of these three bands, we select the dominant frequency, i.e. the loudest one, which contributes most to the composition of the sound.
To the dominant frequency we also give the intensity of its noise. However, in this case it is in a different decibel scale than those you are used to from noise meter measurements. Instead of dBA, we have dBu. This is a finer scale, which is additionally expressed negatively. Be careful of this when studying the results – a noise intensity of -70 dBu is higher than -75 dBu. We discussed this in more detail in the article Get familiar with measuring the frequency response of sound.
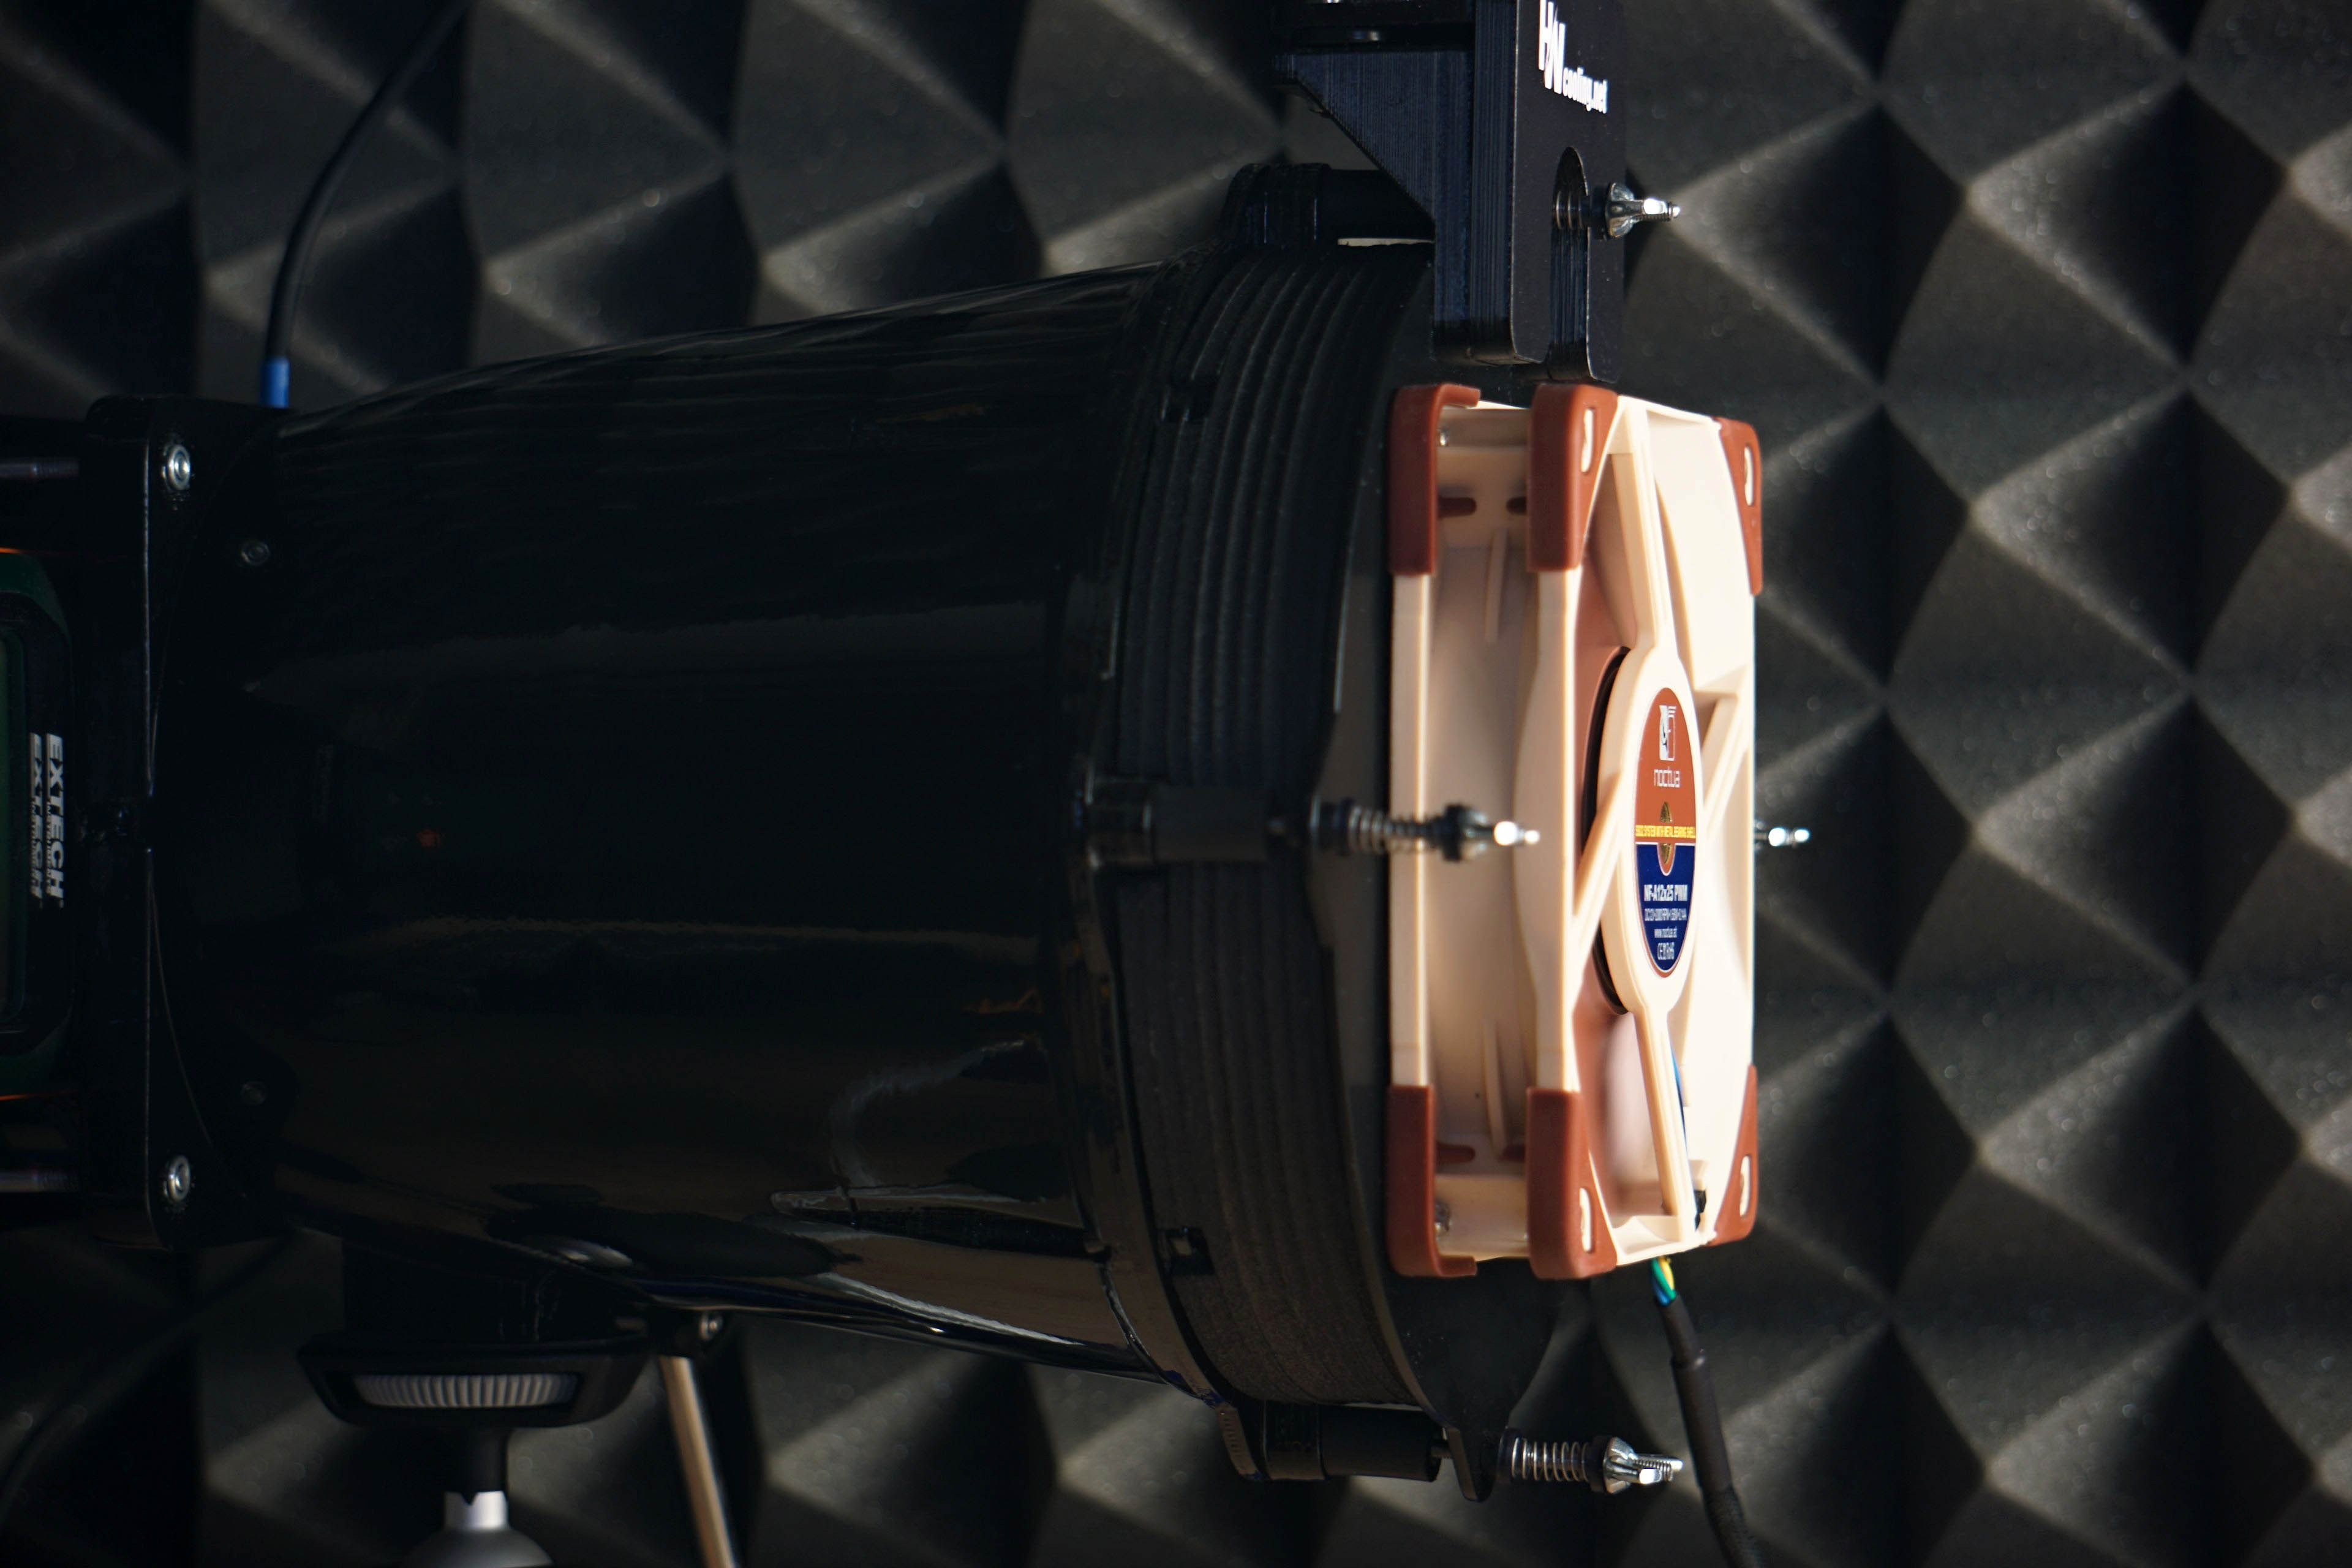
Strict acoustic safeguards are required to ensure that these measurements can be carried out with satisfactory repeatability at all. We use acoustic panels to measure the same values at all frequencies across repeated measurements. These ensure that the sound is always reflected equally to the microphone regardless of the distribution of other objects we have in the testlab. The baseline noise level before each measurement is also naturally the same. The room in which we measure is soundproofed.
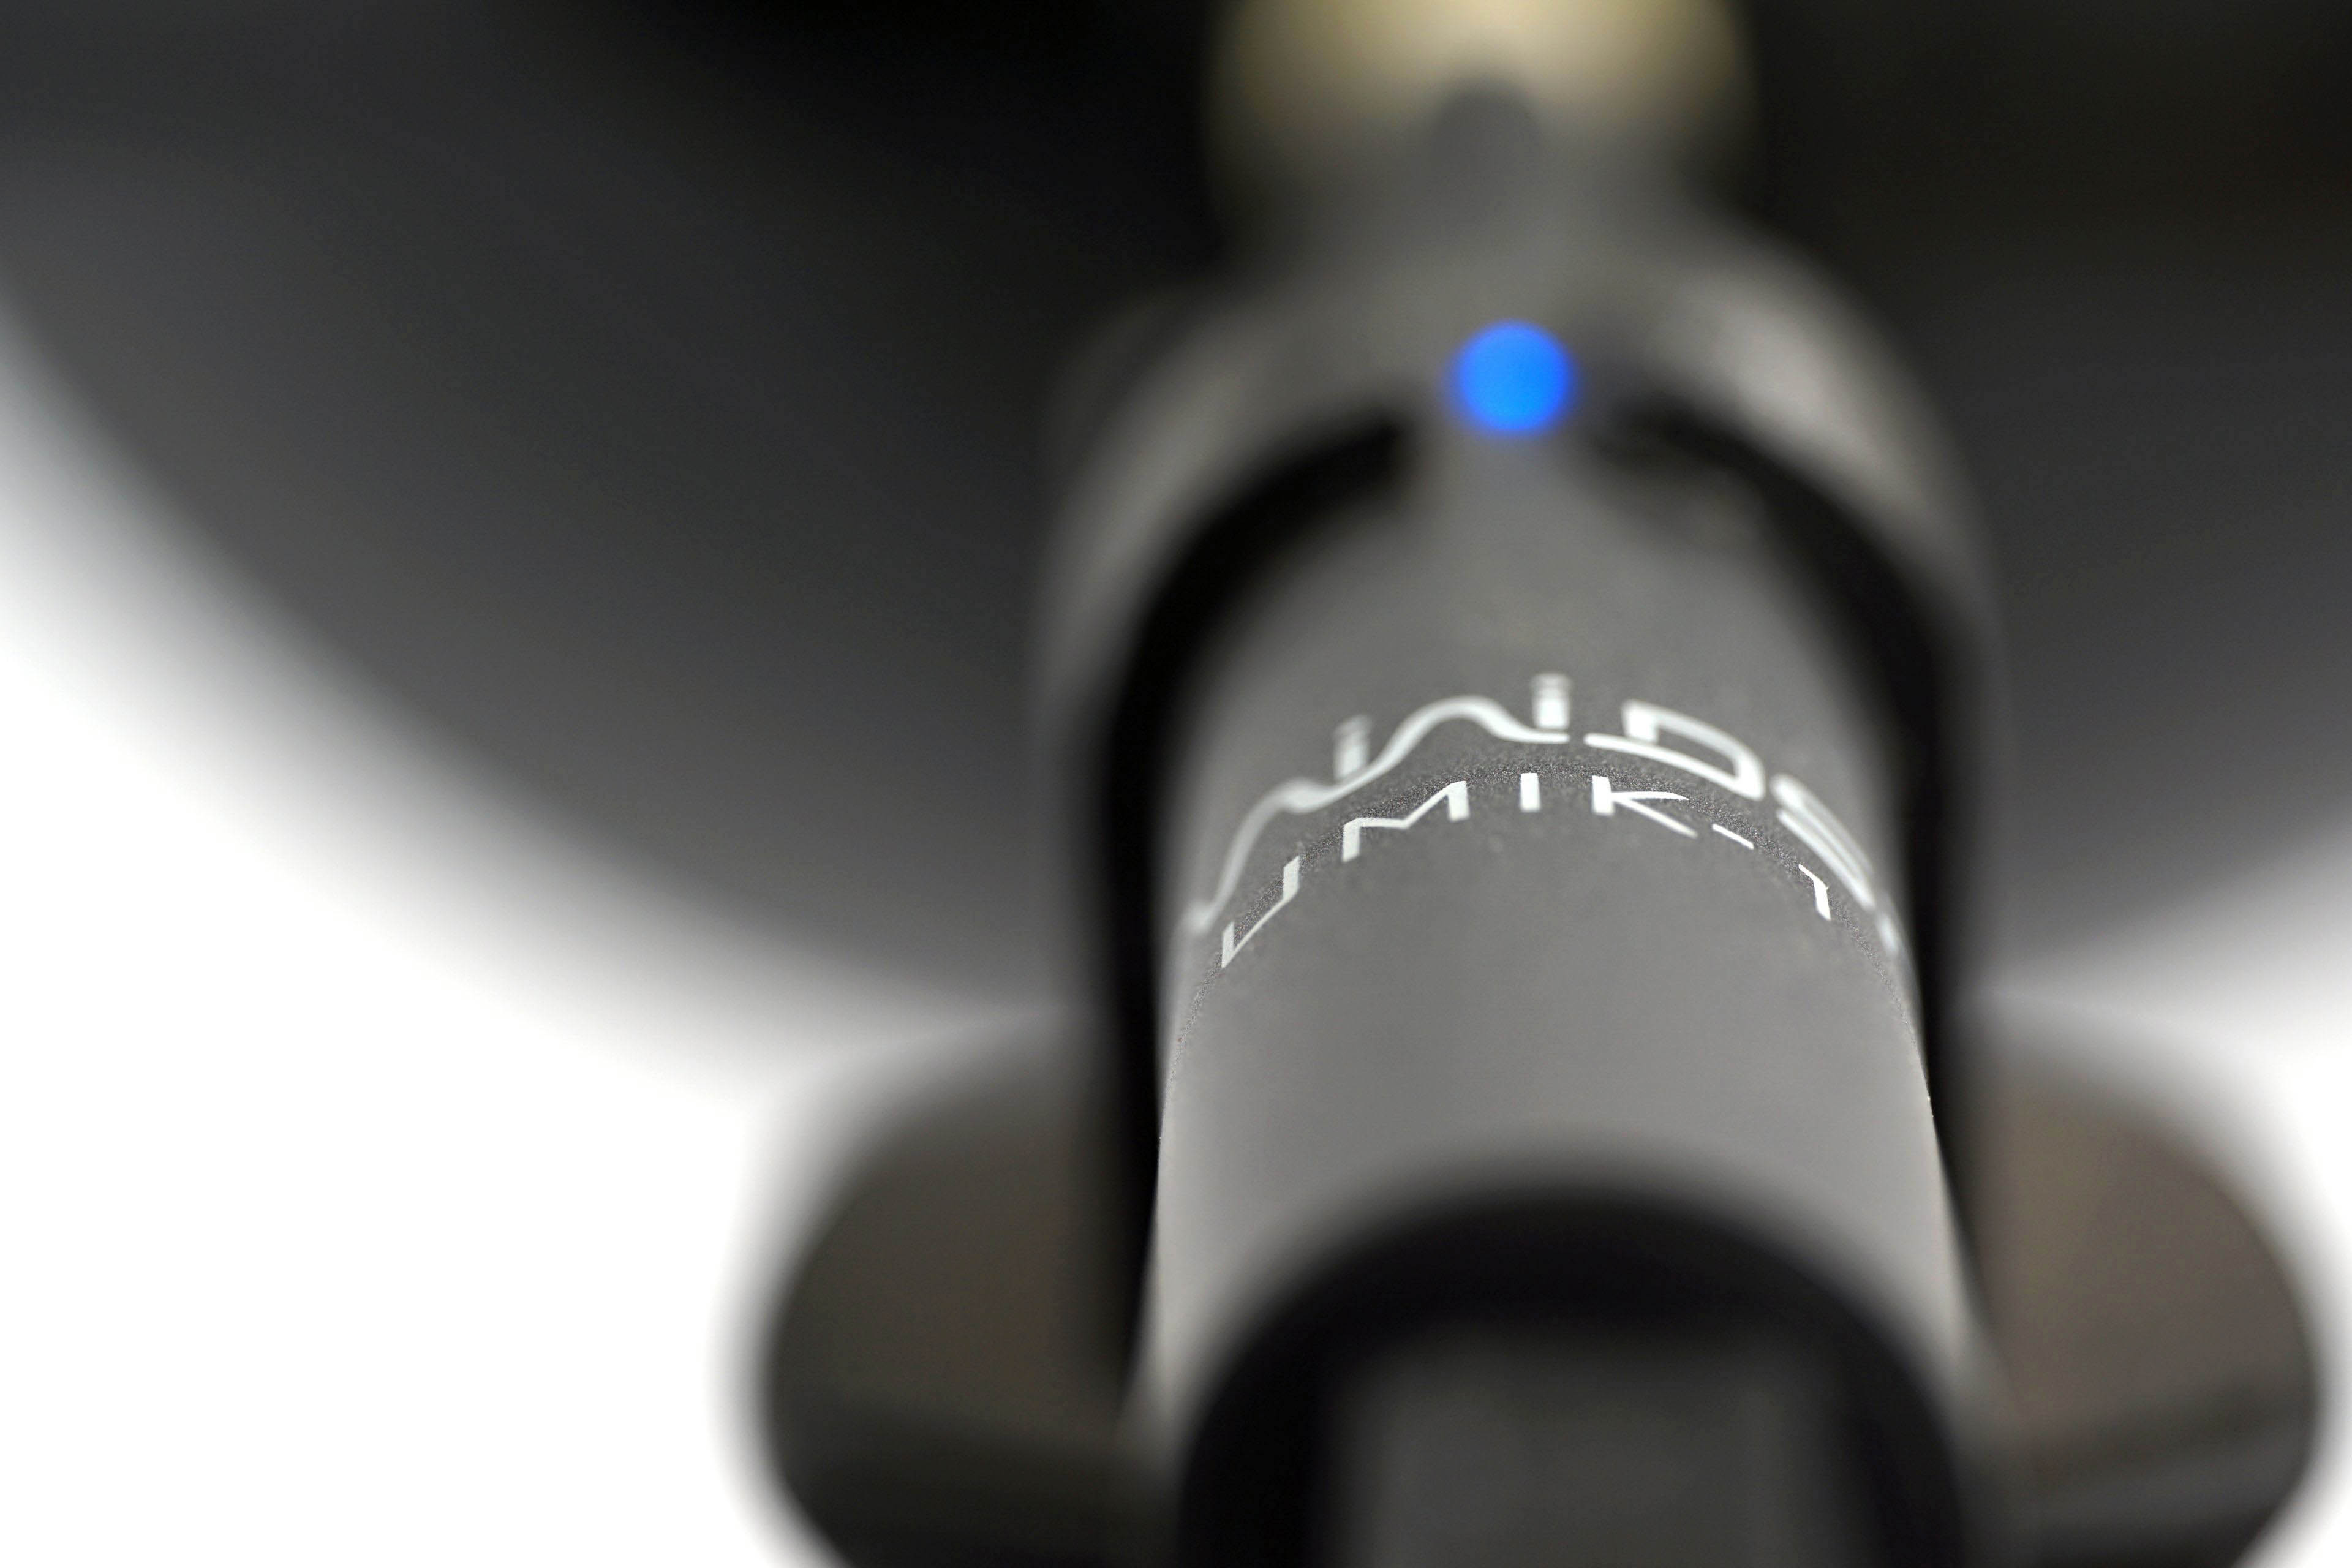
Like the noise meter, the microphone has a parabolic collar to increase resolution. The latter is specially in this case not only to amplify but also to filter out the noises that occur whether we want them or not behind the microphone. We are talking about the physical activity of the user (tester). Without this addition, human breathing, for example, would also be picked up by the spectrograph. However, this is successfully reflected off the microphone sensor by the back (convex) side of the collar. As a result, the spectrogram only contains information about the sound emitted by the fan itself.





While I understand the need to trim down the length of the charts, I miss being able to directly compare between 120 and 140 mm fans in one chart.
Perhaps an article can be made that updates every time a new fan review is posted, that includes all up-to-date charts for all fan formats? This will also make sharing the fan test results easier – the link will always lead to the latest data. Well, at least it would be the stop-gap solution before a proper database is created. Alternatively, add a filter option into the charts that let you toggle some data on or off, though I am not sure how feasible it is.
Another suggestion is to embed the links to the reviews of each fan into the charts themselves.
Thank you for your feedback on this matter. 🙂
We thought about how to do it and whether to do it at all – the separation of 120 mm from 140 mm format fans. In the end, we approached it like this, and maybe it would be a good compromise to release at some intervals (always at the end of the year) a complete database of the results, where both formats are included in one graph?
You have some good ideas about filtering, but here we encounter the limited possibilities of the interactive graphs we use. They are very outdated in their core and while it would be useful to completely rewrite (and modernize) them, unfortunately we don’t have the capacity to do that at the moment.