


Gigabyte has put together a fan that combines ARGB LEDs, clever daisy chaining using connectors in the frame, and very good results on radiators. All of that for an attractive price. The design of the Aorus EZ Chain Fan 120 Ice seems to be optimized for use on radiators in particular. In fact, these are the cheapest ARGB fans with daisy chaining and this kind of efficiency that we’ve ever tested.
… and of airflow
With airflow measurements, we can well explain why the test tunnel is shaped the way it is. It doesn’t consist of two parts just so that the “exhaust” can be conveniently clogged for pressure measurements. The anemometer (i.e. the wind speed measuring instrument) is held together by two parts, two formations, through the flanges.
The front part, at the beginning of which the fan is mounted, becomes steadily narrower and from about two thirds of the way through the cross-section is smaller than that of a 120 mm fan. The reason for this is that the cross-section of the anemometer is always smaller than that of the fans tested. The taper towards the anemometer fan is as smooth as could be chosen and the tunnel walls are smooth. This has minimized the occurrence of unnatural turbulence.
The difference between the cross section at the intake (fan under test) and at the constriction point (anemometer) also means a difference in dynamic pressure, the principles of the Venturi effect apply here. In order to avoid distortion at this level and to ensure that the fan airflow is not different from what it actually is, the Bernoulli equation must be applied to the measured values (for maximum accuracy, the calculation also takes into account the internal cross-sectional area of the anemometer, i.e. its inactive part ). After all this, it is again possible to confront our results with the paper parameters.
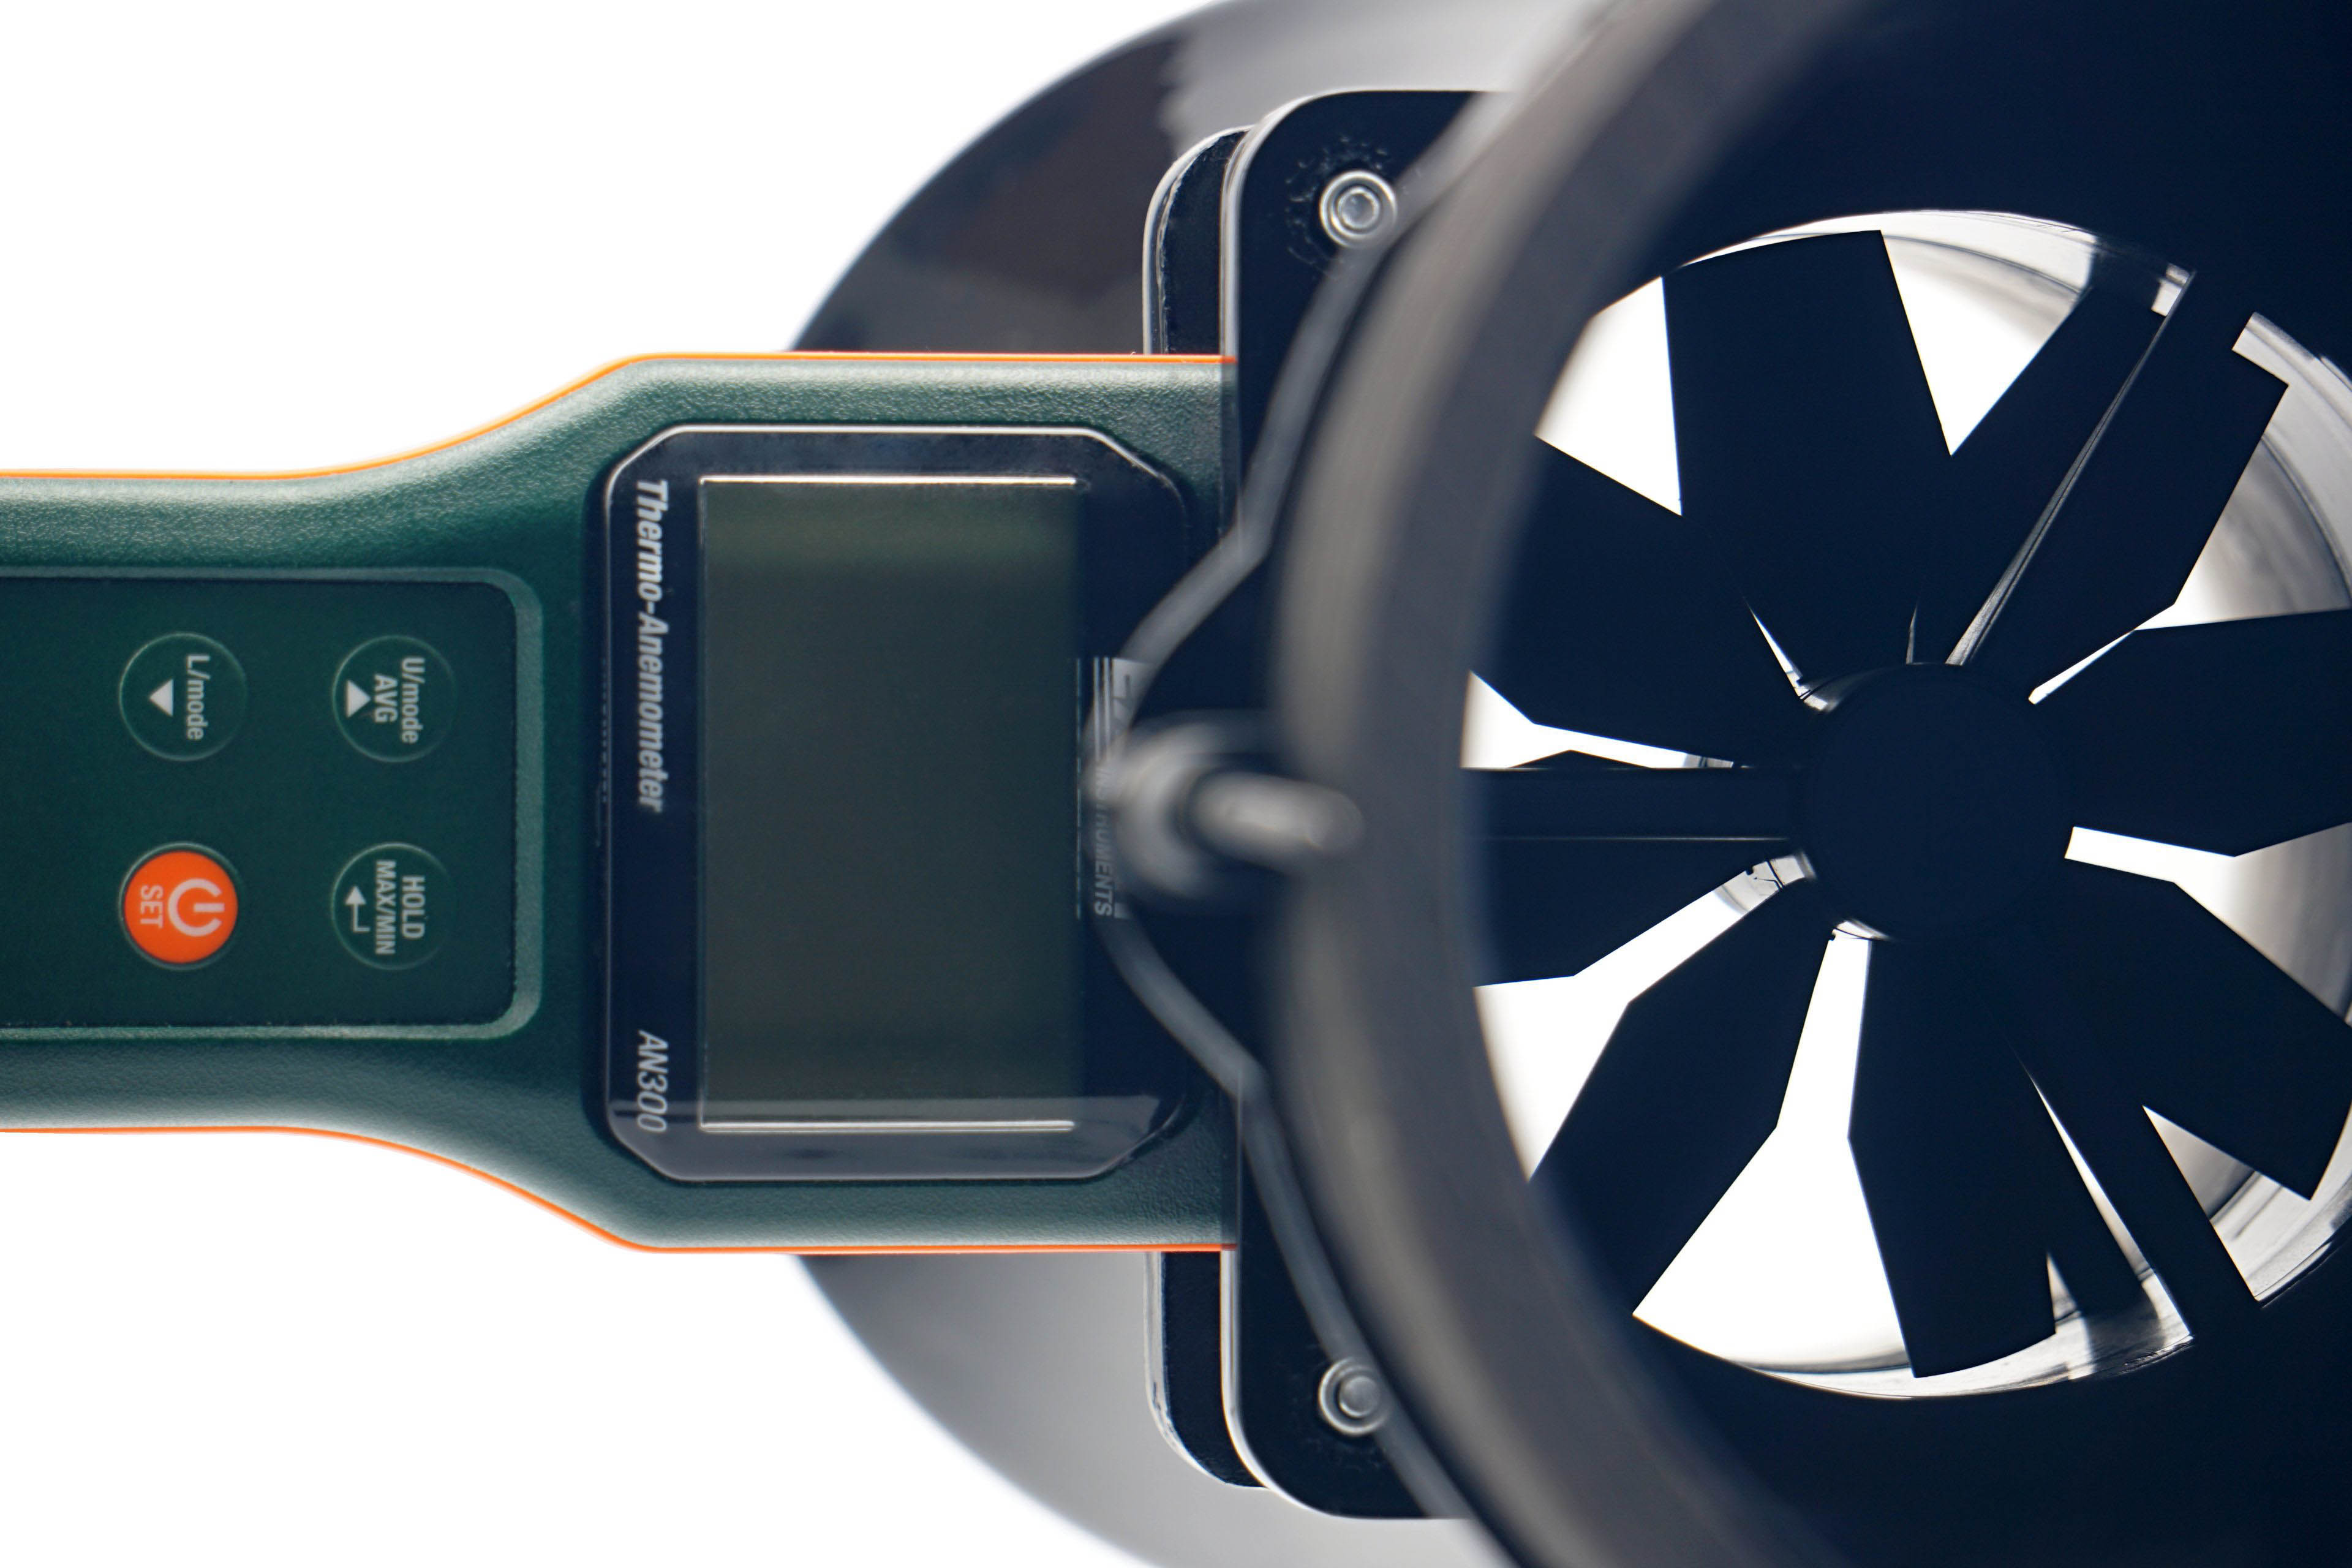
We use an Extech AN300 anemometer with a large 100 mm fan for the measurements. Its big advantage over other anemometers is that it is made for bidirectional sensing. This allows tests at different fan orientations. However, the “pull” position is more suitable or accurate for measurements, even though it may not seem so at first glance, but we’ll explain.
Here, we get to the second part of the tunnel, the part behind the anemometer. It is part of the whole device, mainly to allow a laminar flow of air to arrive at the impeller of the anemometer. Otherwise, uncontrolled side whirls would be reflected in the results, which are inconsistent with accurate measurements. Therefore, we will test the flow in the pull position. If anyone would like us to elaborate more on this topic, we can elaborate further at any time in the discussion below the article. Ask away. 🙂
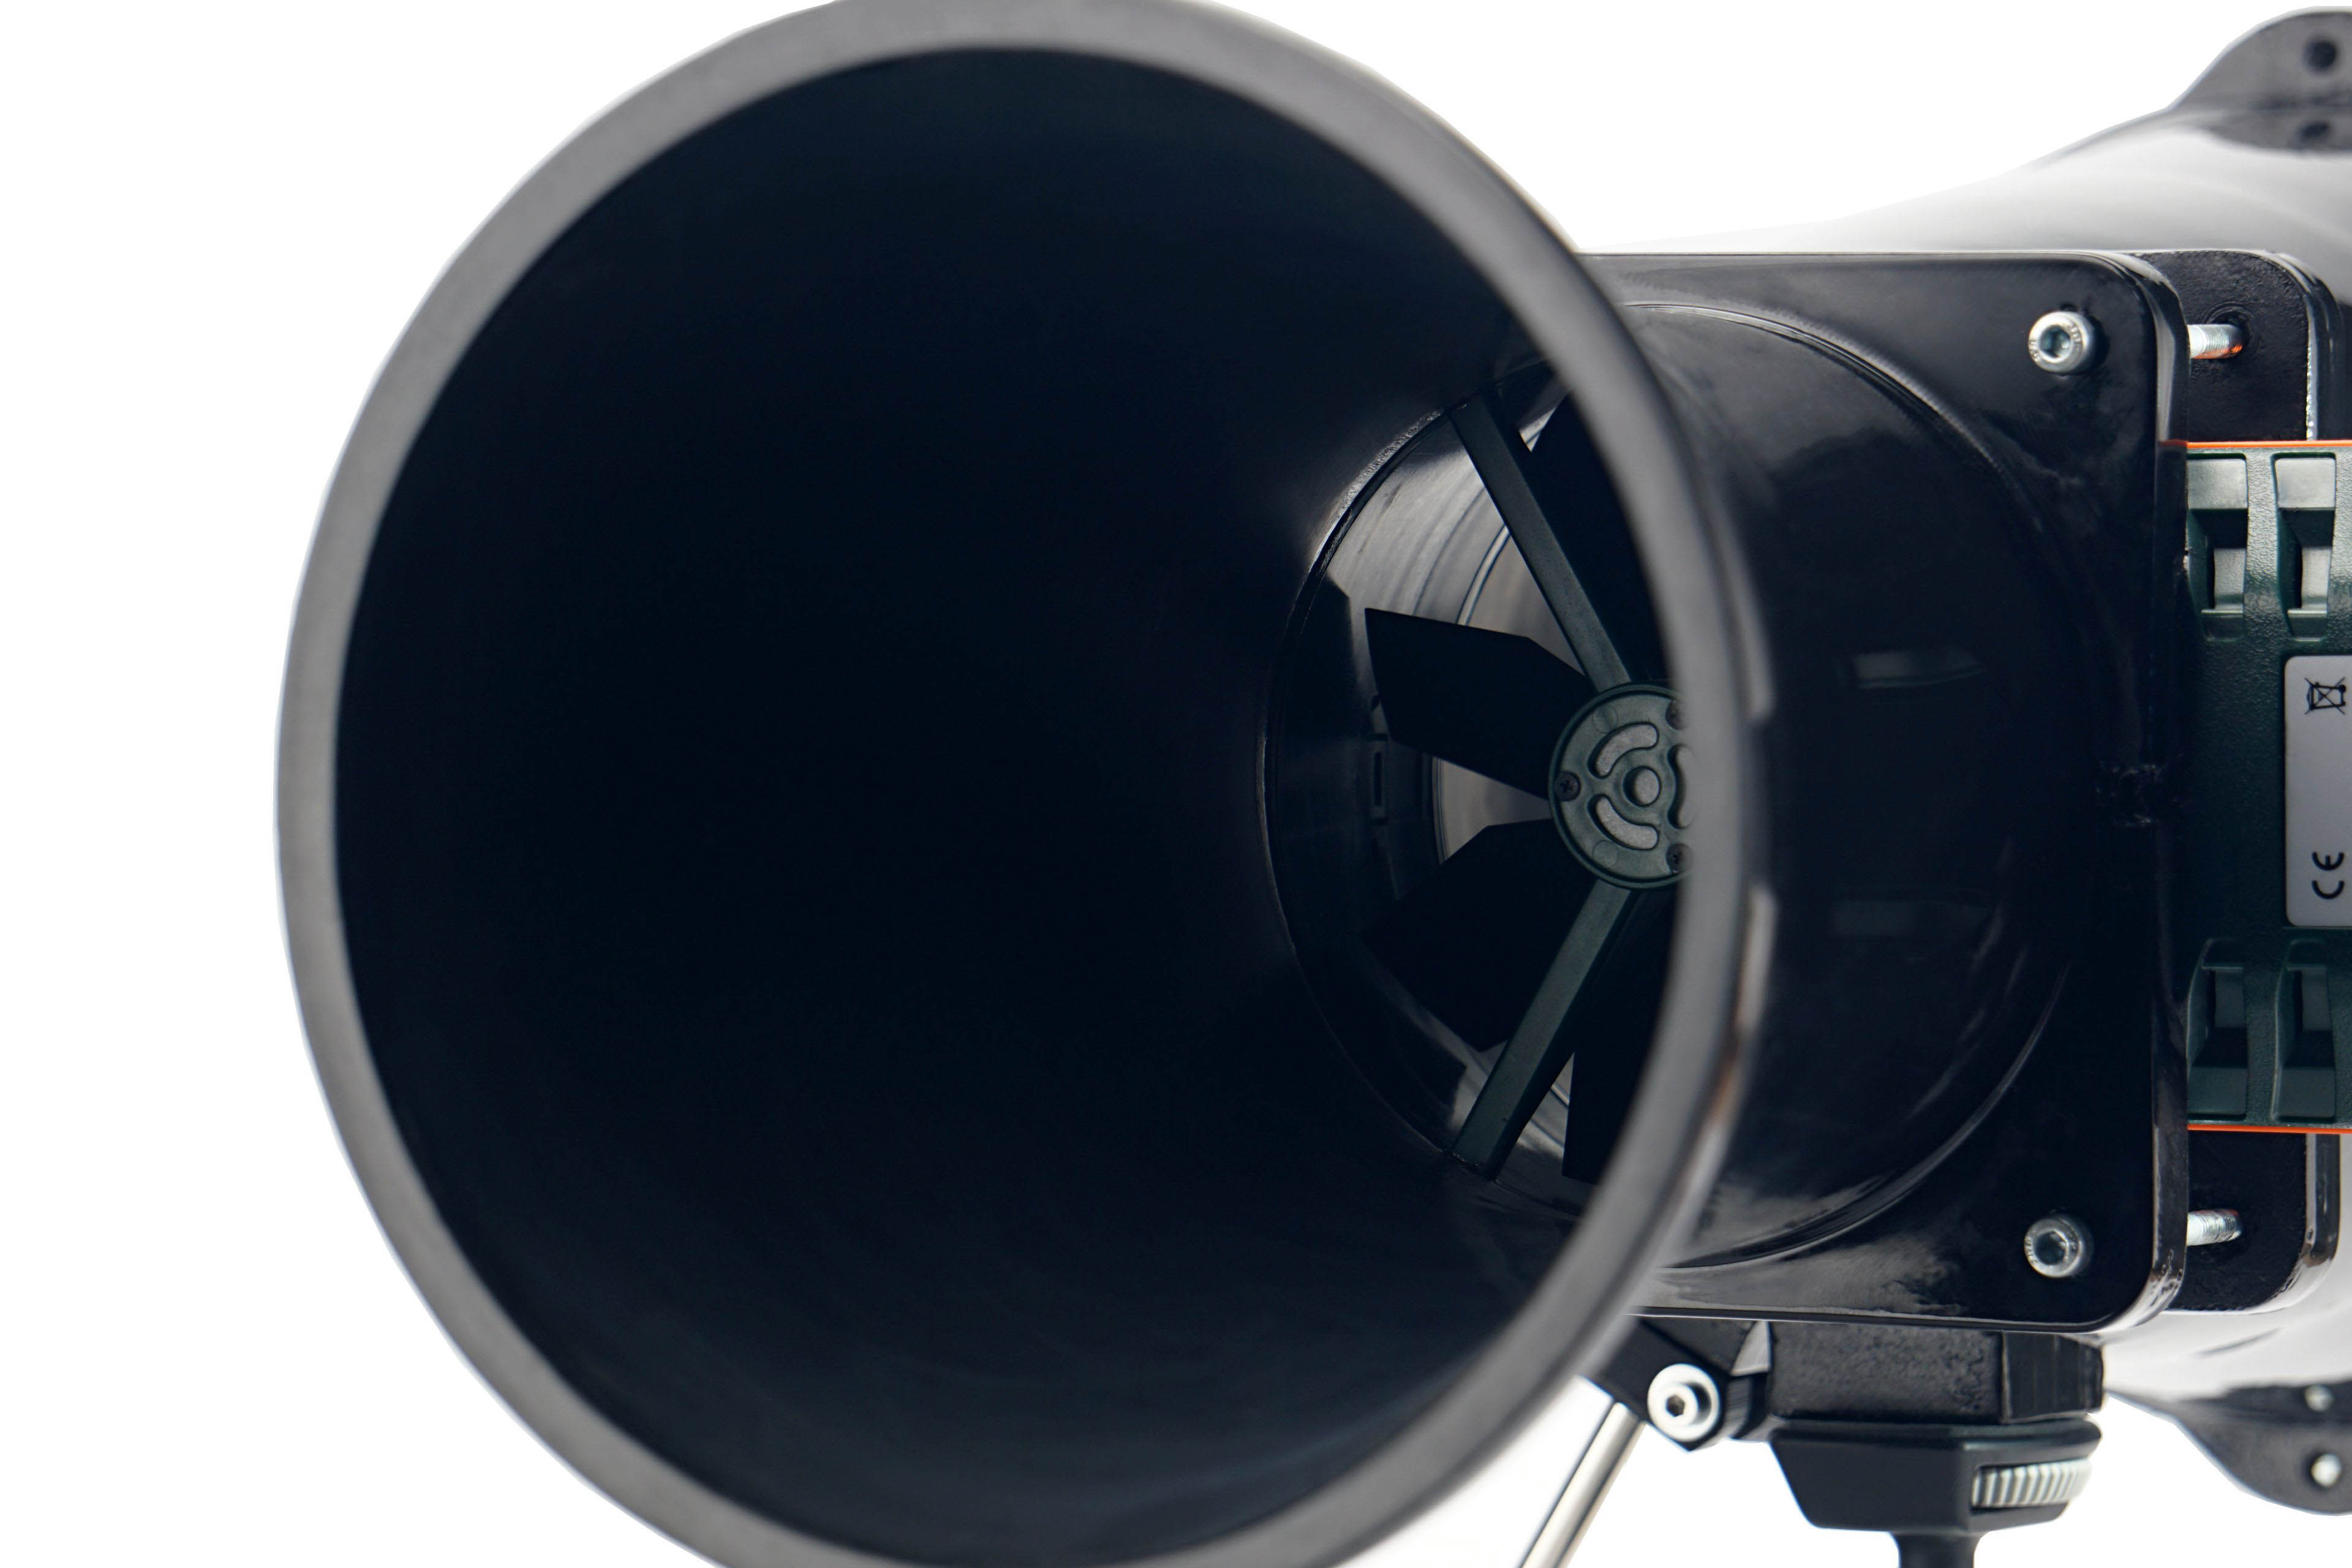
In regard to the anemometer, we shall return for a bit to noise measurements and to setting modes according to fixed noise levels. It may have occurred to you as you were reading that the anemometer fan is also a source of sound that needs to be filtered out when measuring fans. For this reason, we insert a securing pad between the frame and the anemometer fan before each measurement and mode setting according to the fixed noise level. This, by the way, also holds the anemometer fan during static pressure measurements.





While I understand the need to trim down the length of the charts, I miss being able to directly compare between 120 and 140 mm fans in one chart.
Perhaps an article can be made that updates every time a new fan review is posted, that includes all up-to-date charts for all fan formats? This will also make sharing the fan test results easier – the link will always lead to the latest data. Well, at least it would be the stop-gap solution before a proper database is created. Alternatively, add a filter option into the charts that let you toggle some data on or off, though I am not sure how feasible it is.
Another suggestion is to embed the links to the reviews of each fan into the charts themselves.
Thank you for your feedback on this matter. 🙂
We thought about how to do it and whether to do it at all – the separation of 120 mm from 140 mm format fans. In the end, we approached it like this, and maybe it would be a good compromise to release at some intervals (always at the end of the year) a complete database of the results, where both formats are included in one graph?
You have some good ideas about filtering, but here we encounter the limited possibilities of the interactive graphs we use. They are very outdated in their core and while it would be useful to completely rewrite (and modernize) them, unfortunately we don’t have the capacity to do that at the moment.