


Gigabyte has put together a fan that combines ARGB LEDs, clever daisy chaining using connectors in the frame, and very good results on radiators. All of that for an attractive price. The design of the Aorus EZ Chain Fan 120 Ice seems to be optimized for use on radiators in particular. In fact, these are the cheapest ARGB fans with daisy chaining and this kind of efficiency that we’ve ever tested.
Mounting and vibration measurement
Naturally, each tested fan must first be properly mounted. With all that we want to measure, and with the kind of precision that is required for relevant measurements, even the smallest details matter. The whole mounting system is quite complex and we are happy to have fine-tuned it to maximum satisfaction. Even if it meant hundreds of hours of tinkering. What’s so complicated about it? There’s more.
The fans are installed to the multi-purpose bracket. The substrate is a 2 mm thick metal plate to which the fan is attached, or the fan is attached together with an obstacle (e.g. a filter, hexagonal grille or liquid cooler radiator).
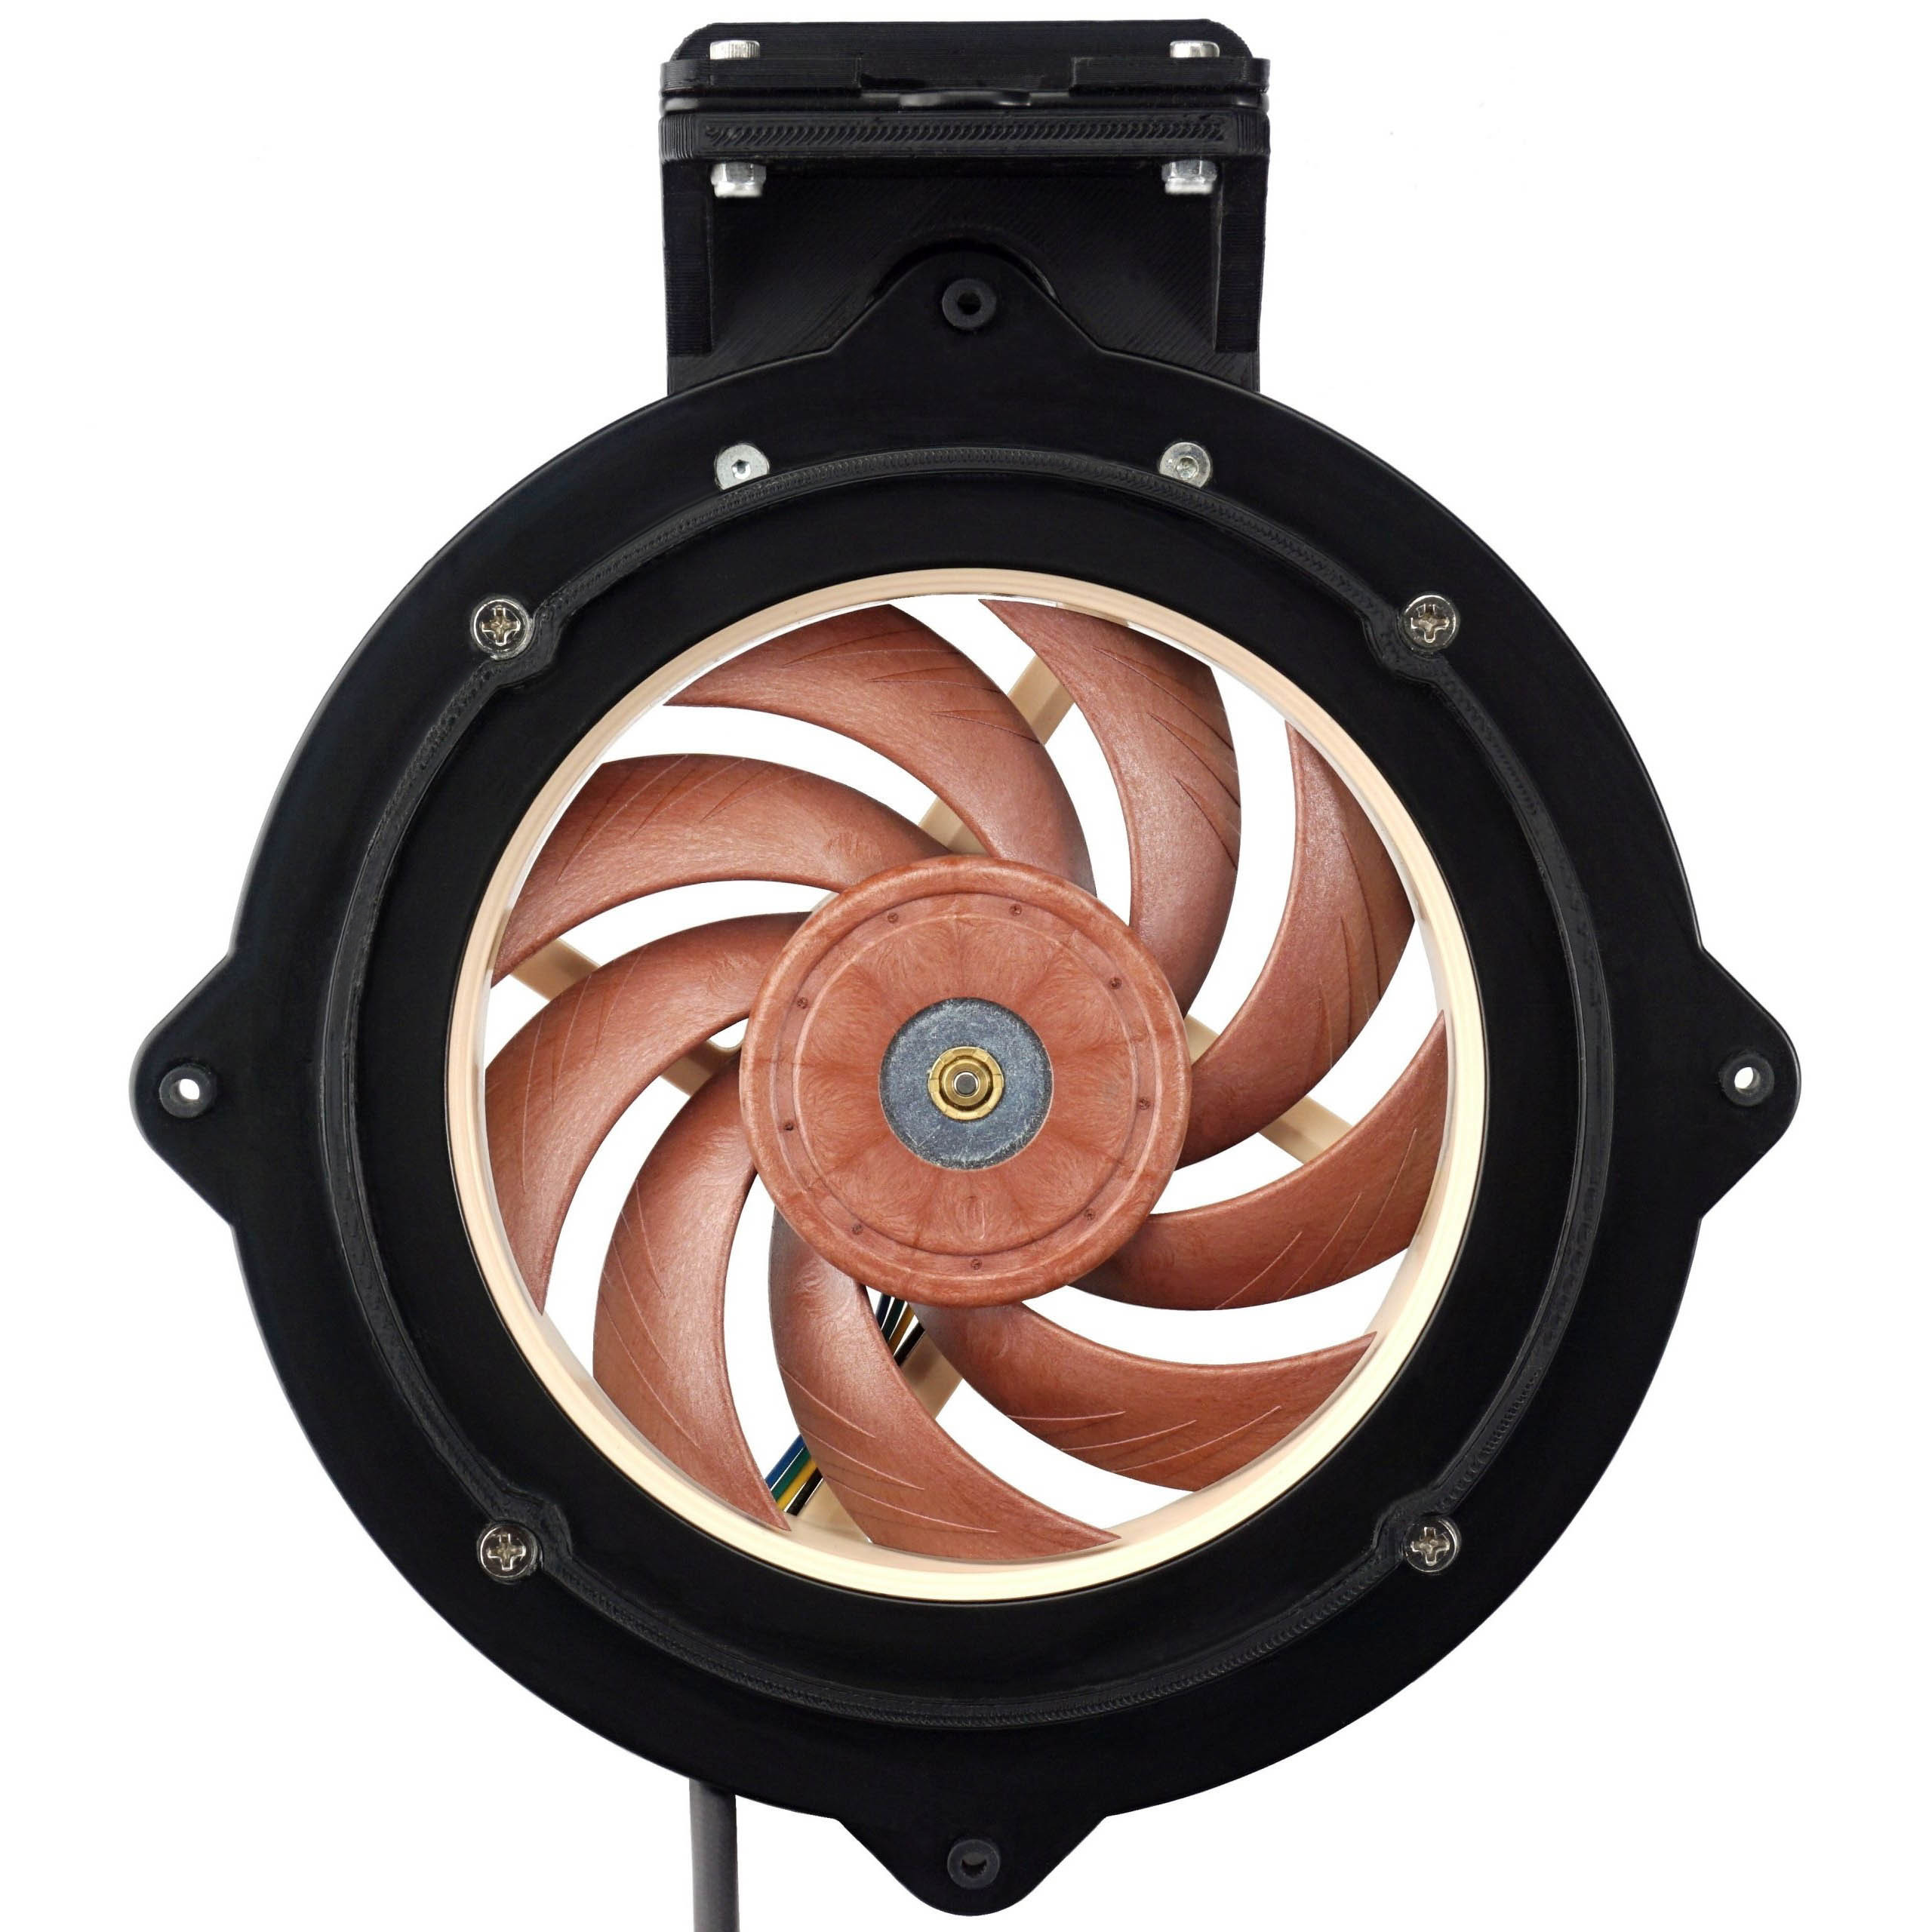
For correct and always equal pressure, the fans are always tightened with the same force with a torque screwdriver. If this were not the case, joints and clearances in the assembly could arise, in short, uneven conditions with undesirable distortion. For example, also for vibration measurement. On top of the fan mount there is also a bracket for the three-axis vibrometer sensor. The latter is magnetically attached via a steel insert, on which the sensor exerts a force of one kilogram and, thanks to the stop, is also always in the same place and in the same contact with the rest of the structure. These are the basics in terms of repeatability of measurements.
In order to capture the intensity at the highest possible resolution, the tray of the holder cannot be too heavy and at the same time it must be strong enough not to twist. This would again cause various distortions. Therefore, we used a hard (H19) aluminium (AL99.5) plate for the construction of the holder, whose weight is just enough so that free movement is not significantly restricted.
To achieve the finest possible resolution for vibration measurement, soft rubber inserts are provided in the mounting holes through which the bracket is installed to the tunnel. And just behind these inserts are silent blocks with a very low hardness of 30 Shore. These are also used so that the vibrations of the fans don’t spread to the tunnel skeleton. If this were to happen, then for fans with more intense vibrations, this secondary noise component, which is not related to the aerodynamic sound of the fan, would also be reflected in the noise measurement results.

This is where it is good to have ideal conditions, even though they are unattainable in practice, because fan vibrations will always be transmitted to the case skeleton to some degree. But each cabinet will react differently to them, or rather the final noise level will depend on a number of factors, starting with the materials used. Therefore, it is a good idea to filter out this extra noise component in tests and in practice take into account the measured vibration intensities. The higher these vibrations are, the higher the noise addition has to be taken into account.
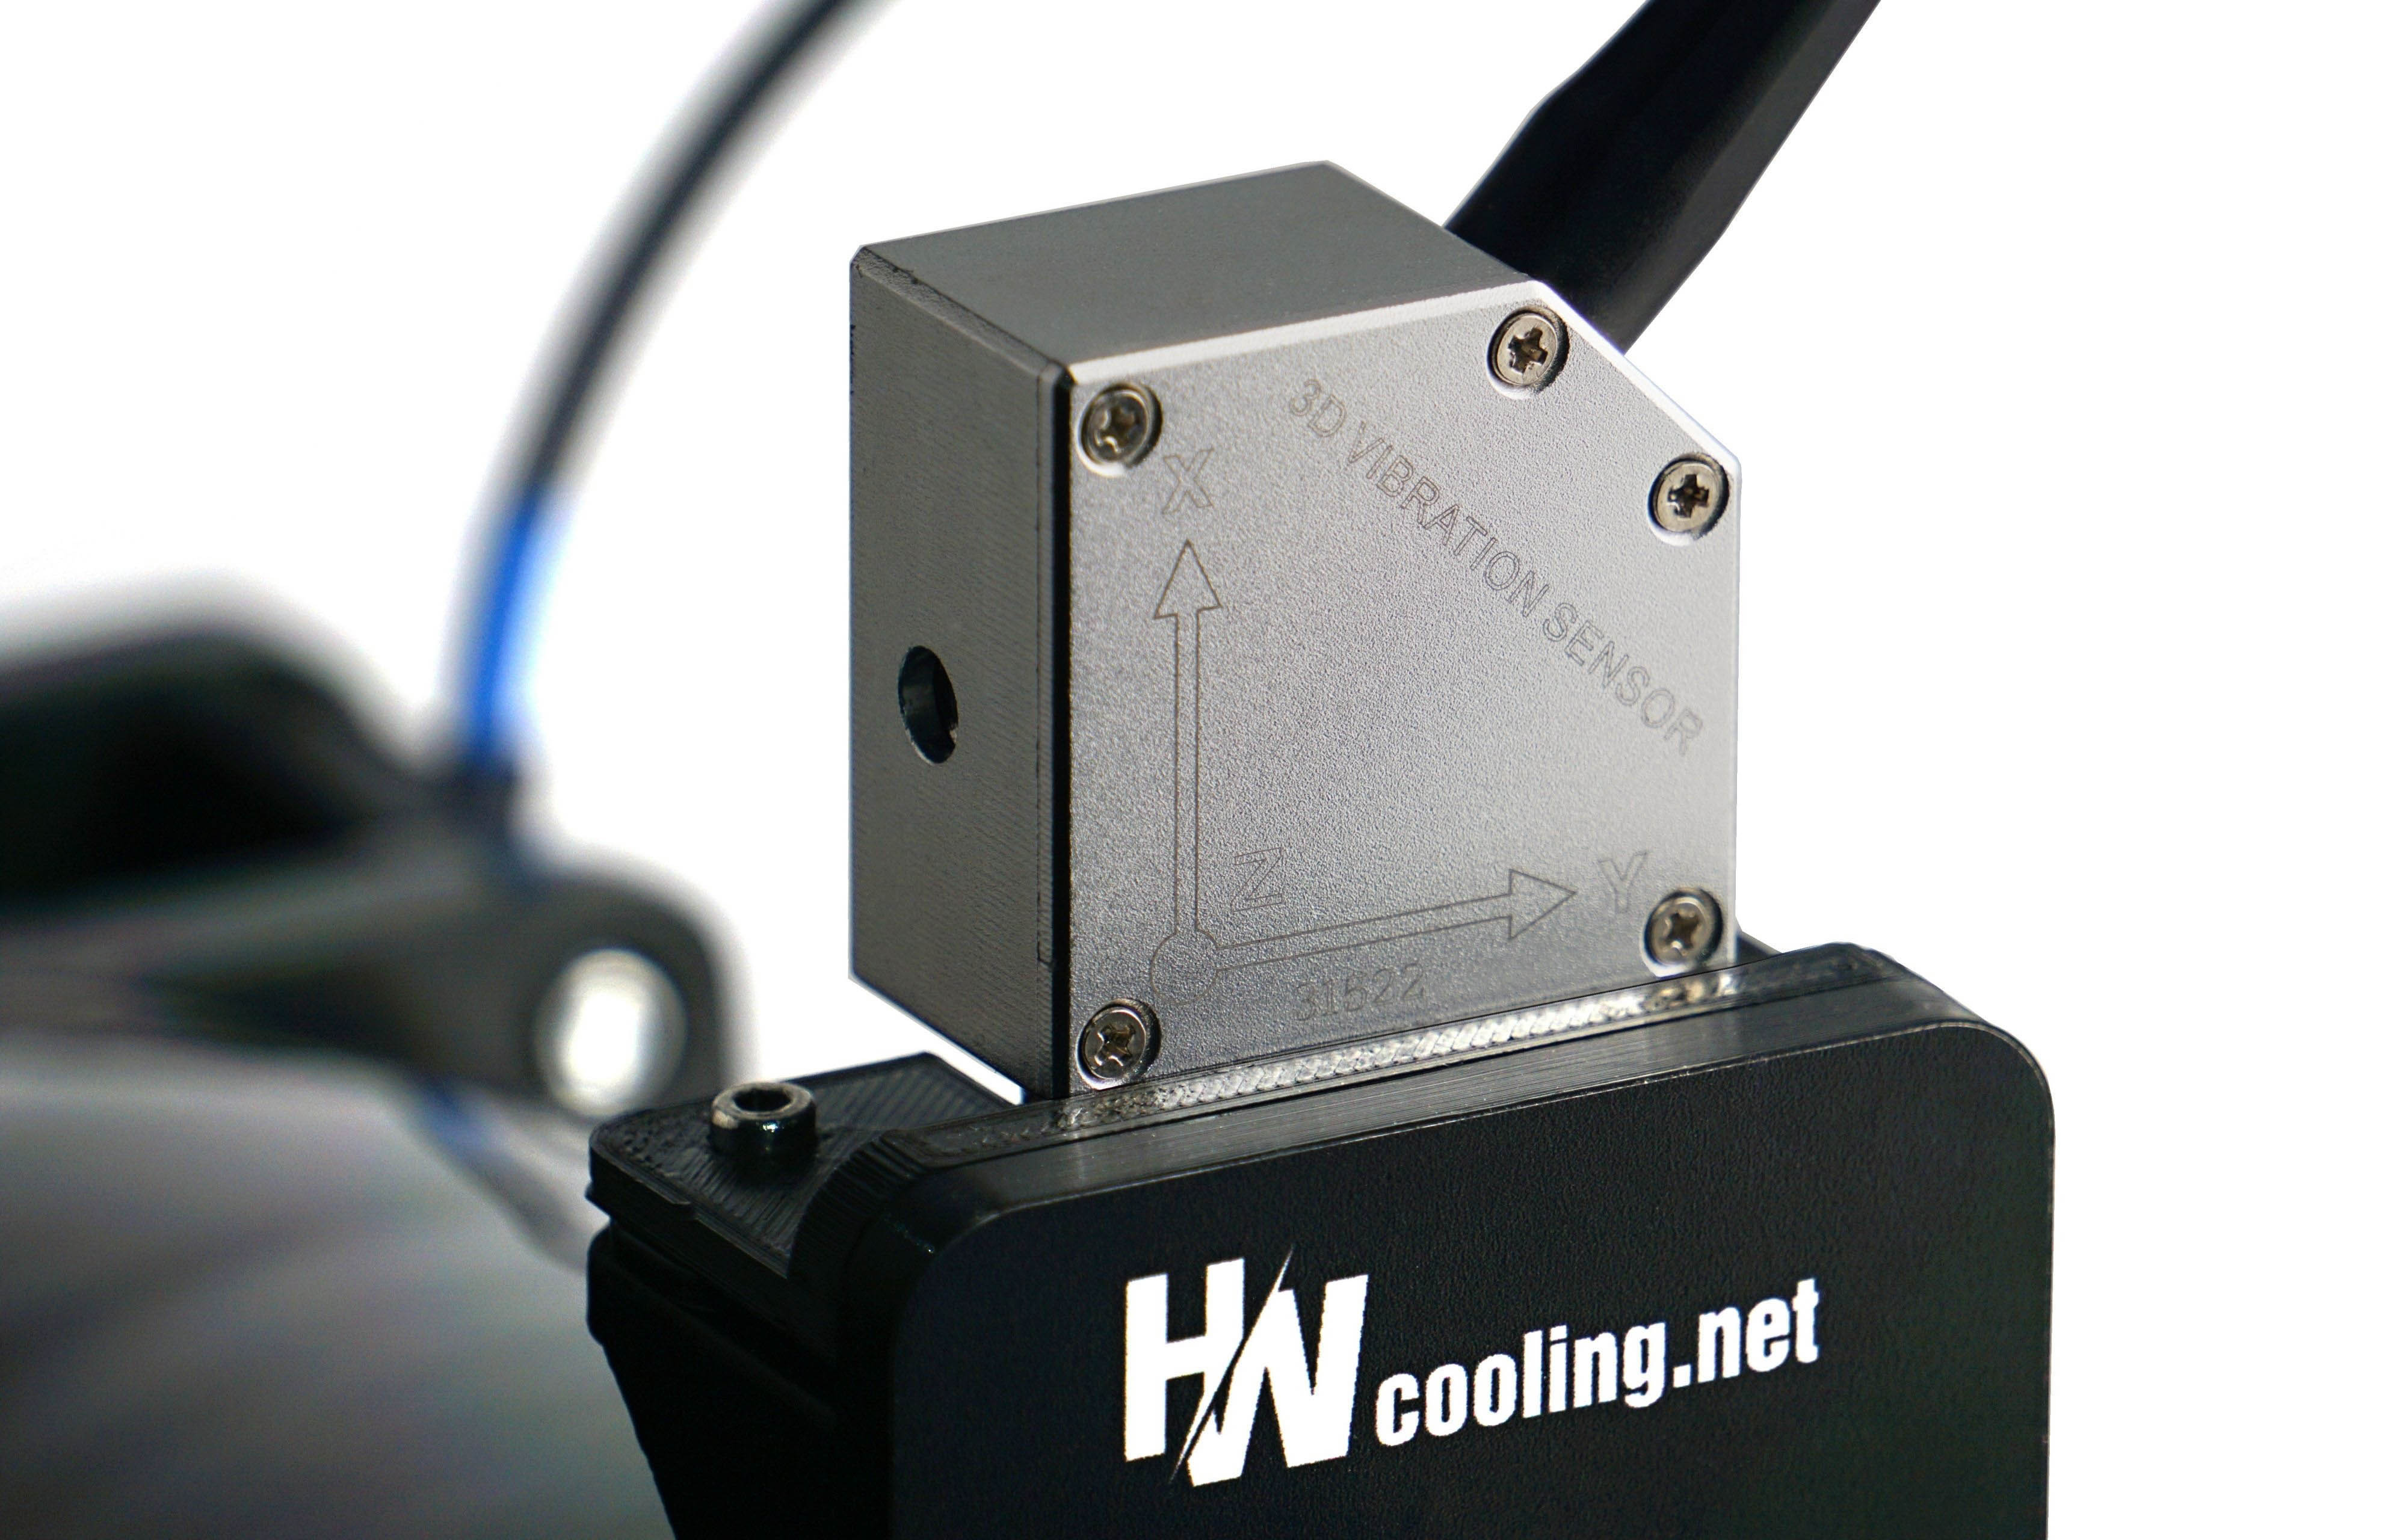
The silent blocks are naturally formatted to offset the bracket a bit from the rest of the tunnel, otherwise they wouldn’t make sense. This creates a gap that is sealed across the entire surface with a soft foam seal with closed cell structure (i.e., it’s airtight).
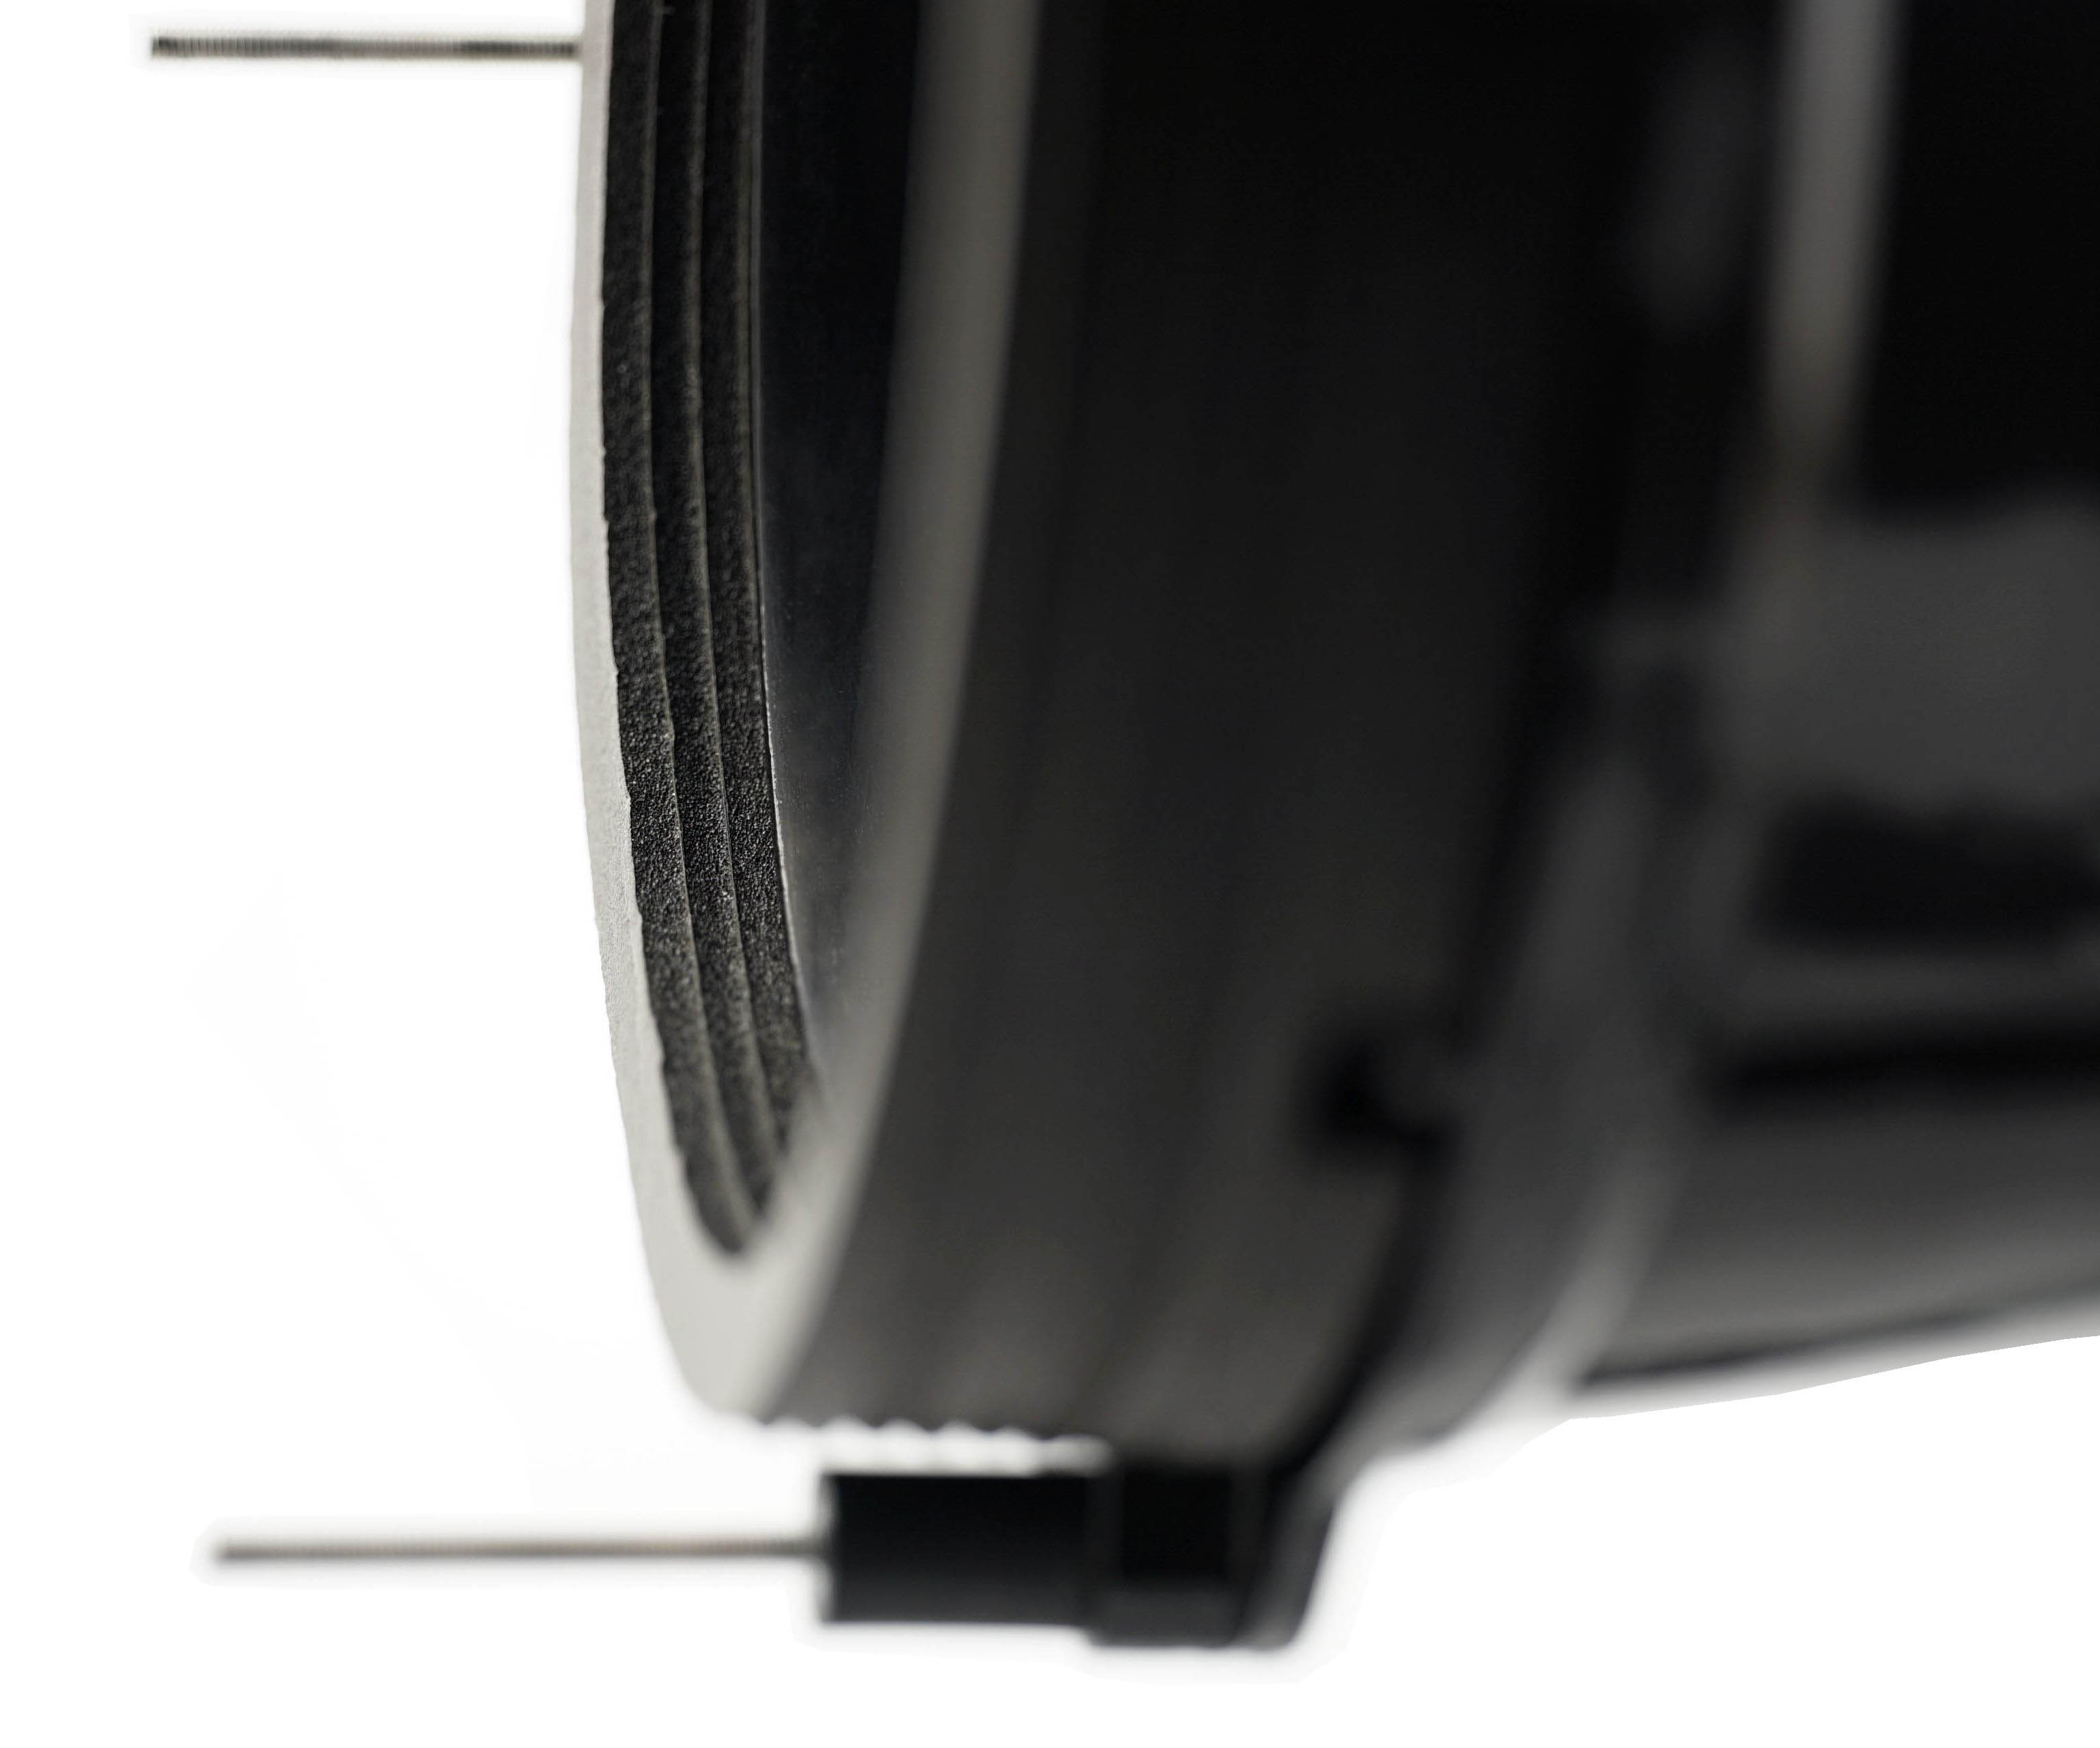
To properly center the fan impeller in relation to the other elements, the bracket includes a protruding frame that follows the inner contour of the seal. And to make matters even more complicated, the frame with the tested fan is pressed against this seal by a small force of compression springs, which in turn is set with the highest possible resolution for vibration measurement in mind and at the same time so that sufficient pressure is generated to maintain a flawless seal.
Vibration is measured with a Landtek VM-6380 vibration meter. It records the vibration speed (in mm) per second in all axes (X, Y, Z). For quick orientation, we calculate a 3D vector from the measured values and graph the “total” vibration intensity. But you can also find your results if you are only interested in a specific axis.
The most complicated part of the tunnel is behind us, and we’ll move on in the next chapter. But we will still stay at the beginning of the tunnel, we will just turn to the peripheries on the sides.






While I understand the need to trim down the length of the charts, I miss being able to directly compare between 120 and 140 mm fans in one chart.
Perhaps an article can be made that updates every time a new fan review is posted, that includes all up-to-date charts for all fan formats? This will also make sharing the fan test results easier – the link will always lead to the latest data. Well, at least it would be the stop-gap solution before a proper database is created. Alternatively, add a filter option into the charts that let you toggle some data on or off, though I am not sure how feasible it is.
Another suggestion is to embed the links to the reviews of each fan into the charts themselves.
Thank you for your feedback on this matter. 🙂
We thought about how to do it and whether to do it at all – the separation of 120 mm from 140 mm format fans. In the end, we approached it like this, and maybe it would be a good compromise to release at some intervals (always at the end of the year) a complete database of the results, where both formats are included in one graph?
You have some good ideas about filtering, but here we encounter the limited possibilities of the interactive graphs we use. They are very outdated in their core and while it would be useful to completely rewrite (and modernize) them, unfortunately we don’t have the capacity to do that at the moment.