


Gigabyte has put together a fan that combines ARGB LEDs, clever daisy chaining using connectors in the frame, and very good results on radiators. All of that for an attractive price. The design of the Aorus EZ Chain Fan 120 Ice seems to be optimized for use on radiators in particular. In fact, these are the cheapest ARGB fans with daisy chaining and this kind of efficiency that we’ve ever tested.
Measurement of static pressure…
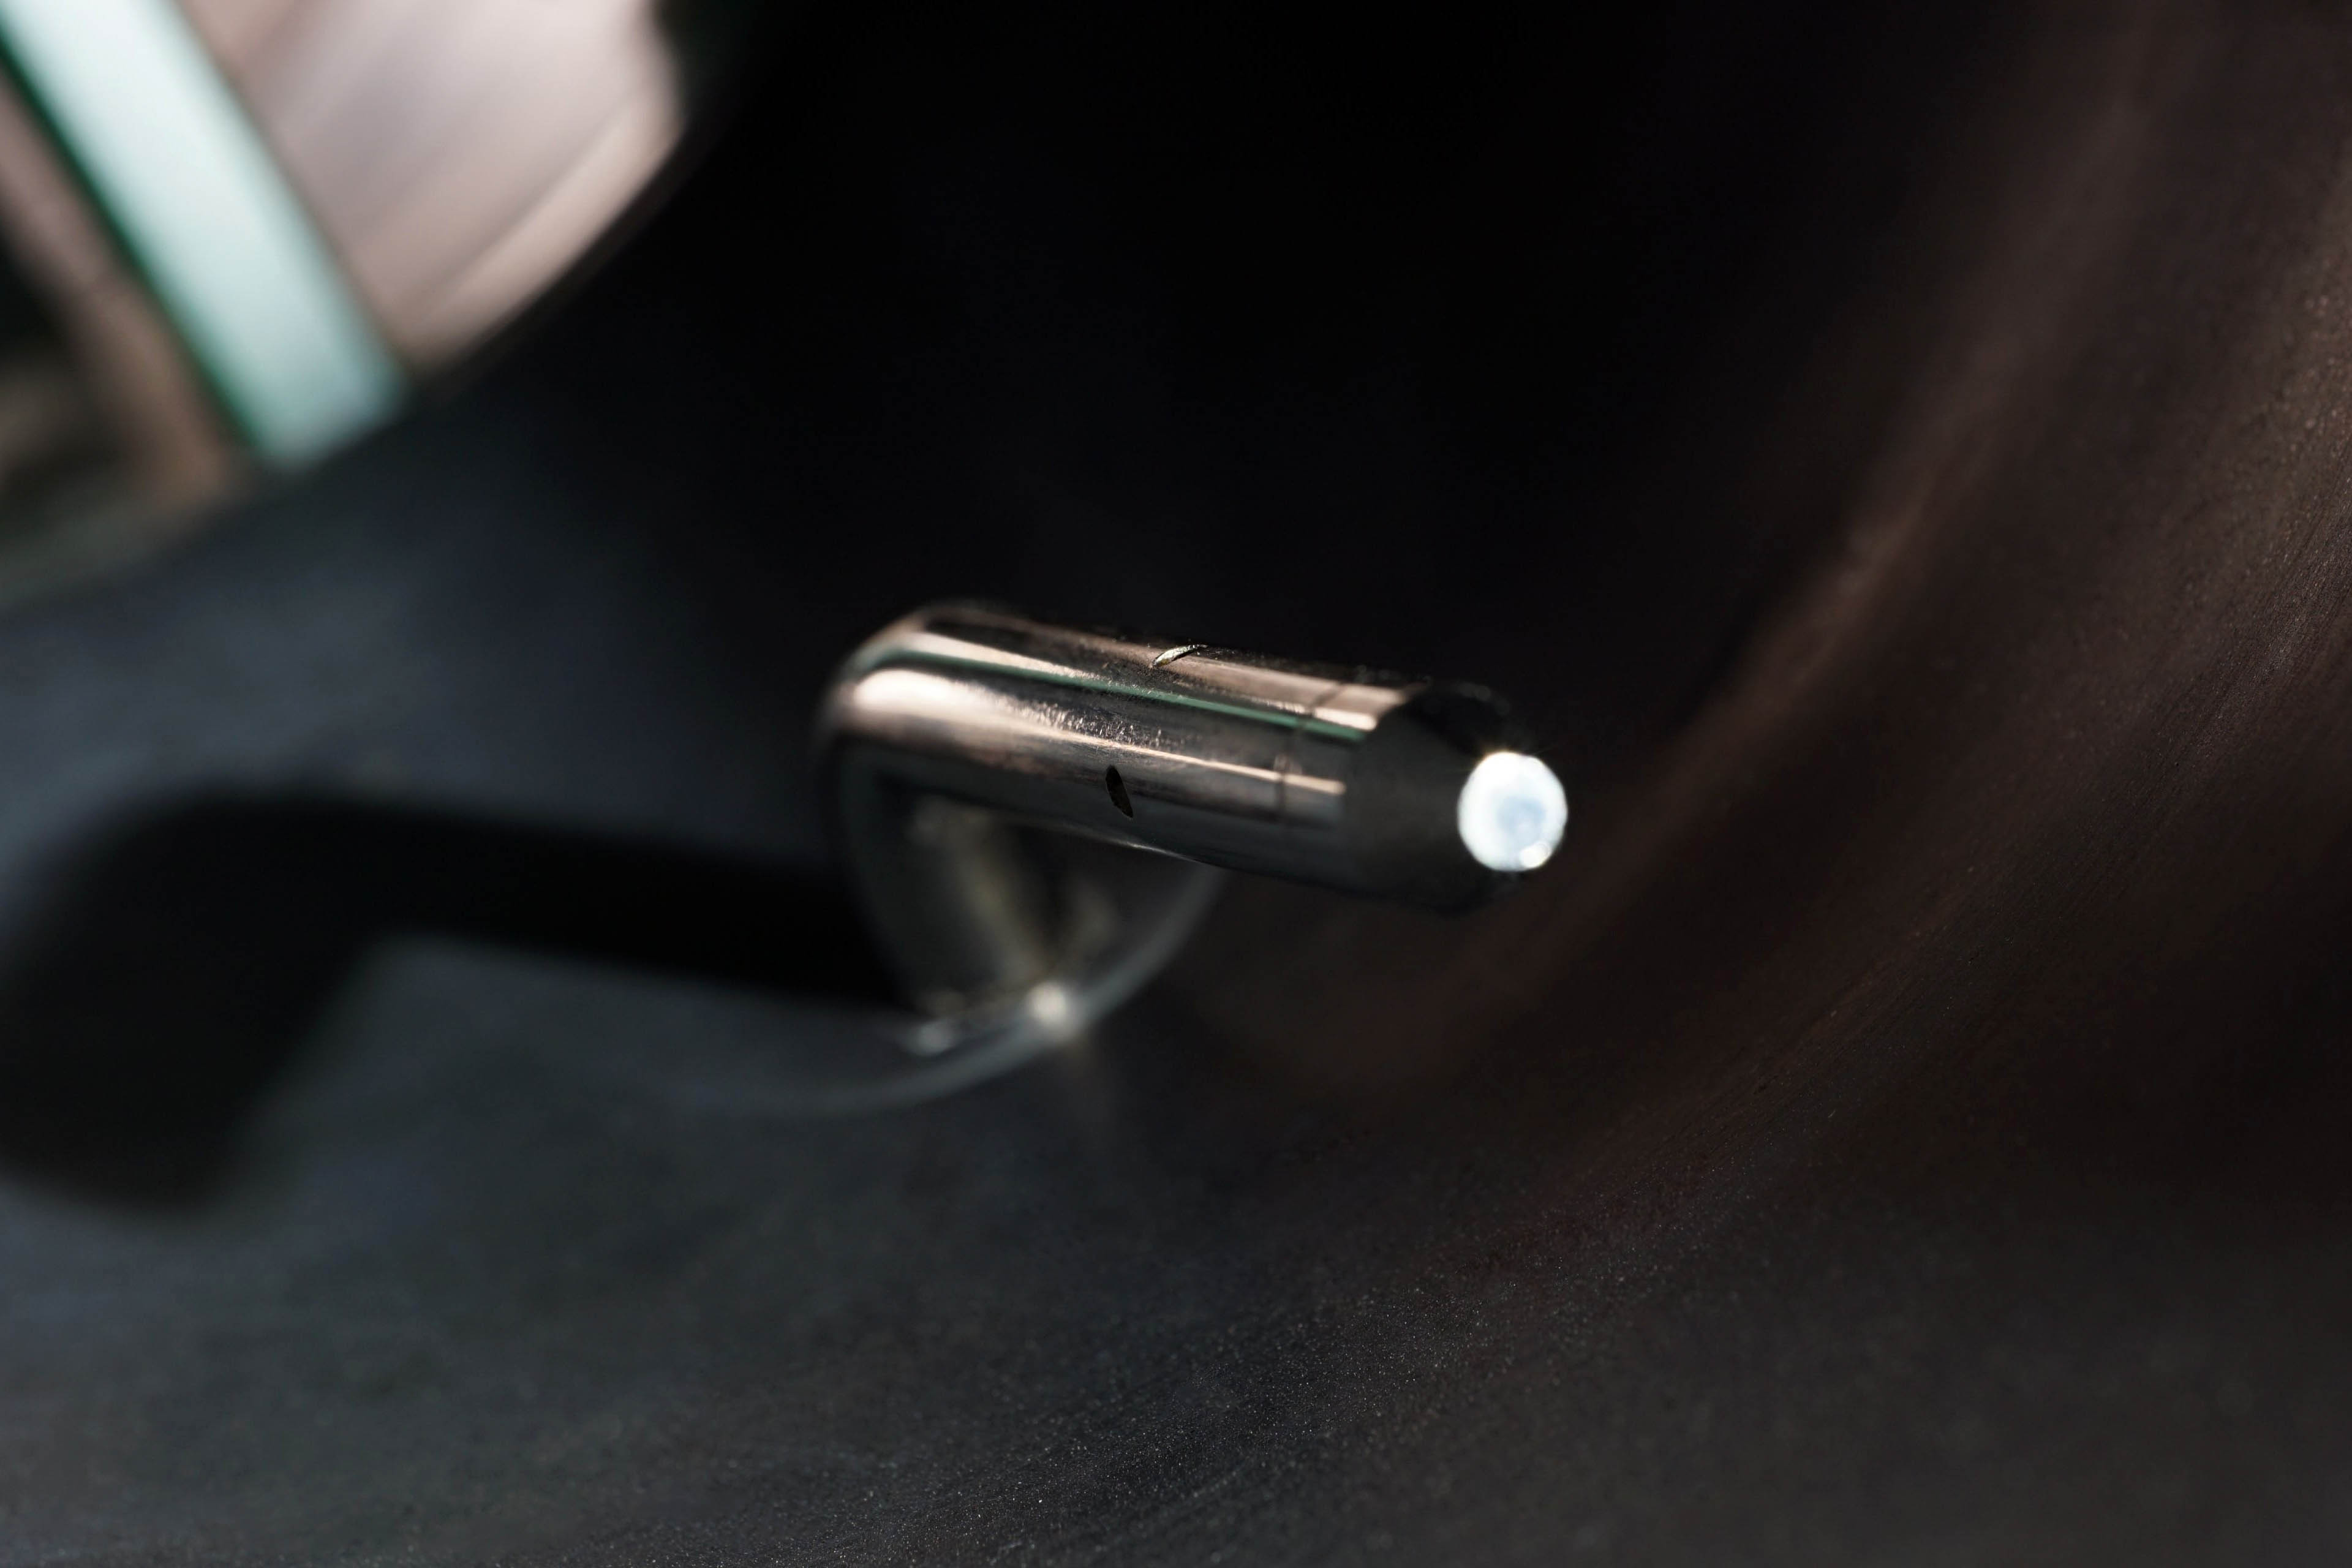
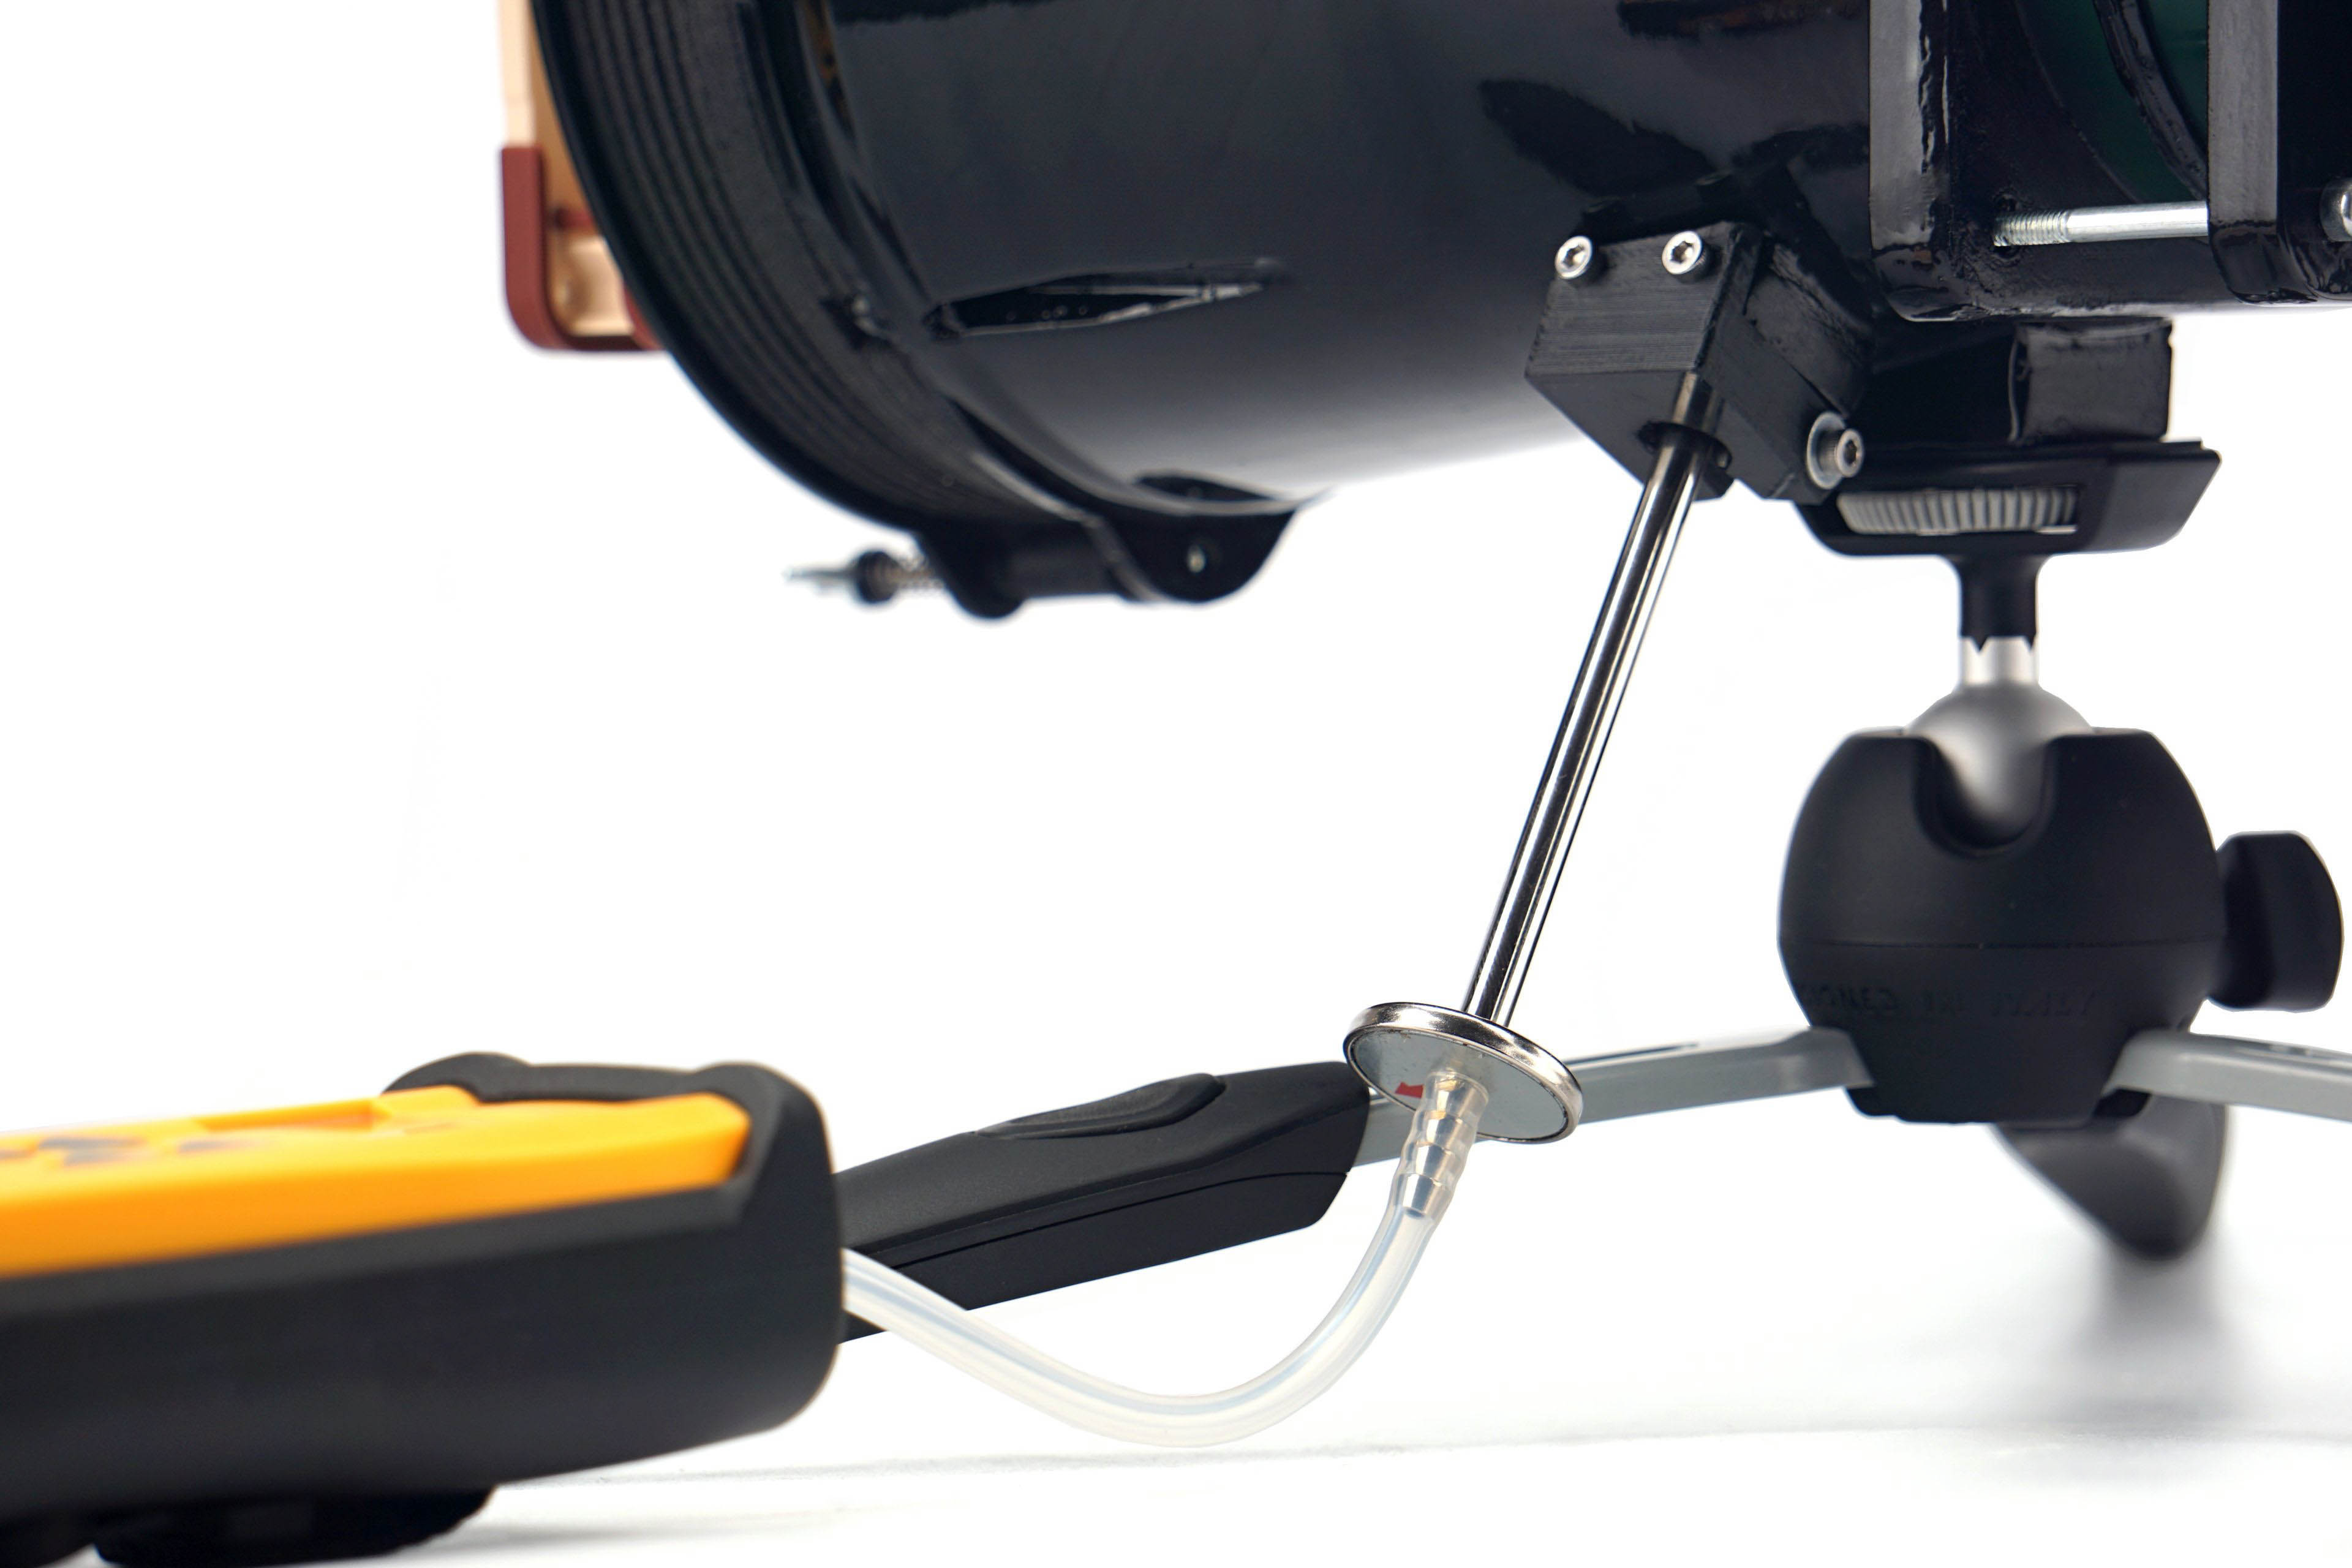
Finally, it is time to move further down the tunnel a bit. Just behind the fan is a static pressure sensing probe. Its position has been chosen with maximum measurement efficiency in mind. In other words, the sensors are placed at the points of highest pressure (although this is virtually the same everywhere in the unconstrained part of the tunnel).
The Fieldpiece ASP2, which is connected to the Fieldpiece SDMN5 manometer, is used to measure the static pressure in the tunnel. The latter also allows measurements in millimetres of water column, but we measure in millibars. This is a more finely resolved base unit for this meter. And only from there we convert the measured values into mm H2O to allow easy comparison with what the manufacturers state.
While we wrote when measuring noise levels that our results could not be compared with the parameters, that is no longer the case here. As long as the fan manufacturers do not embellish the parameters, they should quote approximately the same pressure values as our tests show. The most significant deviations can only arise at the level of varying accuracy of the measuring instruments, but these are negligible percentages.
The greater the difference between the manufacturer’s claimed values and ours, the less the specifications correspond to reality. If the claimed values are significantly higher, it is certainly an intention to artificially give an advantage to the fans on the market. However, if the manufacturer quotes a lower pressure value than we do, it points to something else. Namely, a weaker tightness of the measuring environment. The less tight the tunnel is, the lower the pressure you naturally measure. This is one of the things we tuned for an extremely long time, but in the end we ironed out all the weak spots. Whether it’s the passage for the probe itself, the flanges around the anemometer, even the anemometer frame itself, which is made up of two parts, needed to be sealed in the middle. Finally, the flap at the tunnel outlet must also be perfectly tight. That’s because static pressure has to be measured in zero airflow.

But there is one thing that often lowers the pressure of the fans a bit. And that’s protruding anti-vibration pads in the corners or otherwise protruding corners. In other words, when the fan doesn’t fit perfectly to the mounting frame at the inlet, and there are small gaps around the perimeter, that also affects what you measure. But we have not gone into this because it is already a quality feature of the fan. In the same way, it will “stand out” and perform a bit weaker than it has the potential to do with better workmanship, even after application by the end user.





While I understand the need to trim down the length of the charts, I miss being able to directly compare between 120 and 140 mm fans in one chart.
Perhaps an article can be made that updates every time a new fan review is posted, that includes all up-to-date charts for all fan formats? This will also make sharing the fan test results easier – the link will always lead to the latest data. Well, at least it would be the stop-gap solution before a proper database is created. Alternatively, add a filter option into the charts that let you toggle some data on or off, though I am not sure how feasible it is.
Another suggestion is to embed the links to the reviews of each fan into the charts themselves.
Thank you for your feedback on this matter. 🙂
We thought about how to do it and whether to do it at all – the separation of 120 mm from 140 mm format fans. In the end, we approached it like this, and maybe it would be a good compromise to release at some intervals (always at the end of the year) a complete database of the results, where both formats are included in one graph?
You have some good ideas about filtering, but here we encounter the limited possibilities of the interactive graphs we use. They are very outdated in their core and while it would be useful to completely rewrite (and modernize) them, unfortunately we don’t have the capacity to do that at the moment.