


Gigabyte has put together a fan that combines ARGB LEDs, clever daisy chaining using connectors in the frame, and very good results on radiators. All of that for an attractive price. The design of the Aorus EZ Chain Fan 120 Ice seems to be optimized for use on radiators in particular. In fact, these are the cheapest ARGB fans with daisy chaining and this kind of efficiency that we’ve ever tested.
Base 6 equal noise levels…
There are several options by which to normalize the test modes for fans. In the previous chapter, we wrote that perhaps the least appropriate option is equal speed.
Settings according to the same static pressure or flow are for consideration, but we find it most sensible in the long term to normalize the measurement modes according to the same noise levels. Firstly because decibels are a logarithmic unit and all others scale linearly, but mainly because you can orientate fastest by the same noise levels. The easiest way to compare the efficiency of fans is just by how they perform at the same sound pressure level. Of all the options, this is the one that most people can best imagine and bounce off of when considering other variables.
The individual noise level modes are adjusted from low levels continuously to higher levels. All users will find their results in the tests, regardless of whether they prefer very quiet operation at the limit of audibility or whether high performance is paramount.
The quietest mode corresponds to 31 dBA, followed by 33 dBA, and for each additional mode we add 3 dBA, which always doubles the noise level (36, 39, 42 and 45 dBA). Finally, we measure the fans at maximum power. Here, each one already has a slightly different noise level, which we also report. If there are missing measurements between the results for any of the fans, this means that it was not possible to set the target noise level. Either because its minimum speed exceeds the quietest mode of 31 dBA or vice versa because the fan is quieter than 45 dBA at maximum power.
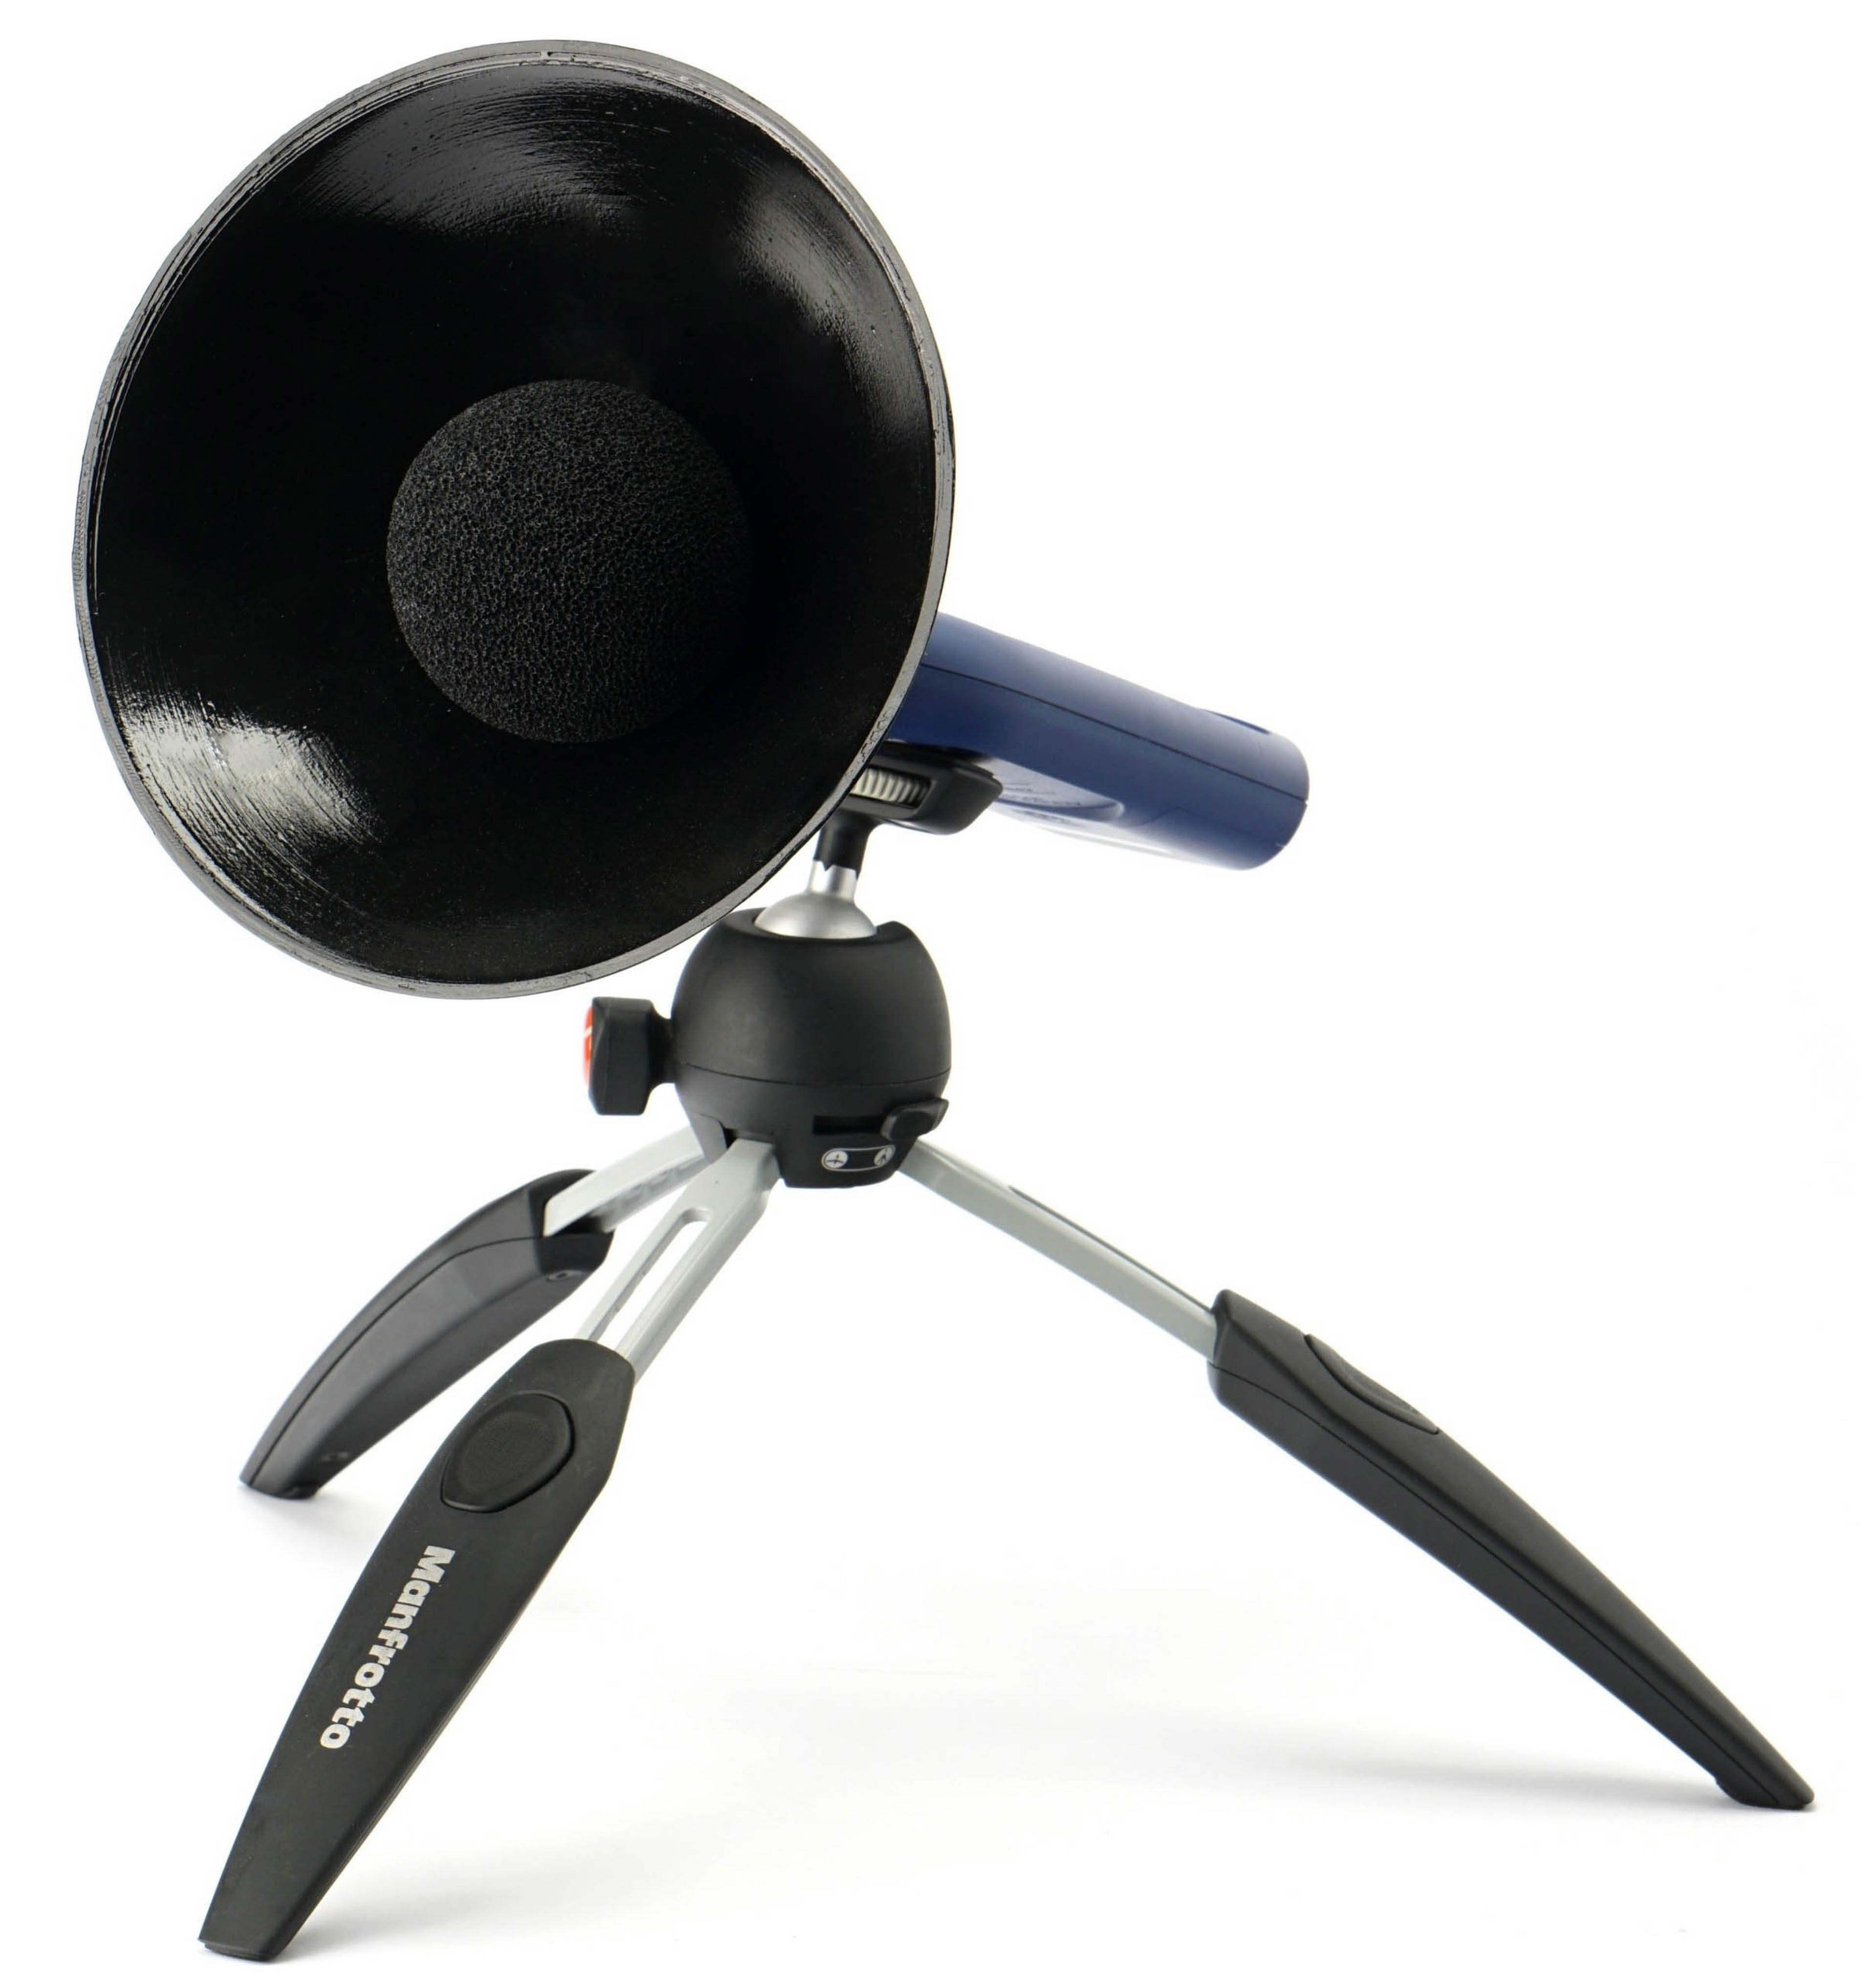
It is important to add that our noise level measurements are incomparable to the values quoted by the fan manufacturers in their specifications. One of the reasons is because we use a parabola-shaped collar around the sensor of the noise meter, which increases sensitivity. This is important in order to distinguish and set to the same noise level even modes at very low speeds, especially 31 dBA.
The noise meter next to the fan is quite close for sufficient resolution. The distance between the frame and the sensor is 15 centimeters. The sensor is positioned in such a way that there is no distortion or that the noise level measurements are not affected by airflow. Therefore, the noise meter is centered perpendicularly to the frame that defines the depth of the fan. Everything is always at the same angle and at the same distance. We use an inclinometer and markers to set the distances precisely and always the same.

We use a Reed R8080 noise meter to measure noise levels. This allows real-time averaging of samples, which is important for fine-tuning individual modes. We tune the fans until the specified noise level is reached to two decimal places, for example 31.50 dBA. The noise meter is the only instrument we calibrate inside our testlab. The other instruments have been calibrated by the relevant technical institutes. However, in the case of the noise meter, calibration is required before each test and we therefore have our own calibrator. This is already calibrated externally according to the standard.





While I understand the need to trim down the length of the charts, I miss being able to directly compare between 120 and 140 mm fans in one chart.
Perhaps an article can be made that updates every time a new fan review is posted, that includes all up-to-date charts for all fan formats? This will also make sharing the fan test results easier – the link will always lead to the latest data. Well, at least it would be the stop-gap solution before a proper database is created. Alternatively, add a filter option into the charts that let you toggle some data on or off, though I am not sure how feasible it is.
Another suggestion is to embed the links to the reviews of each fan into the charts themselves.
Thank you for your feedback on this matter. 🙂
We thought about how to do it and whether to do it at all – the separation of 120 mm from 140 mm format fans. In the end, we approached it like this, and maybe it would be a good compromise to release at some intervals (always at the end of the year) a complete database of the results, where both formats are included in one graph?
You have some good ideas about filtering, but here we encounter the limited possibilities of the interactive graphs we use. They are very outdated in their core and while it would be useful to completely rewrite (and modernize) them, unfortunately we don’t have the capacity to do that at the moment.